Scroll Up Top
Download icon
Download

Key takeaways include:

  • Direct Lending is by far the single largest strategy within private credit today, having grown from 9% to 36% of total assets under management over the last 15 years.1
  • This growth has been fueled by borrower need and investor demand. Middle market companies have flocked to direct lenders as the number of banks has fallen by 53%,2 and investors have seen Sharpe ratios enhanced by allocating more of their portfolios to Direct lending.
  • Direct Lending’s main target market, the middle market borrower, has demonstrated lower default rates and loss ratios when compared to the large corporate market for syndicated loans, based on 25 years of historic data.3

Direct Lending is a type of Private Credit strategy that makes direct, illiquid loans to middle market companies outside of the traditional banking system. Direct Lending usually refers to first lien loans as well as unitranche loans that combine different debt classes or liens into a single loan.

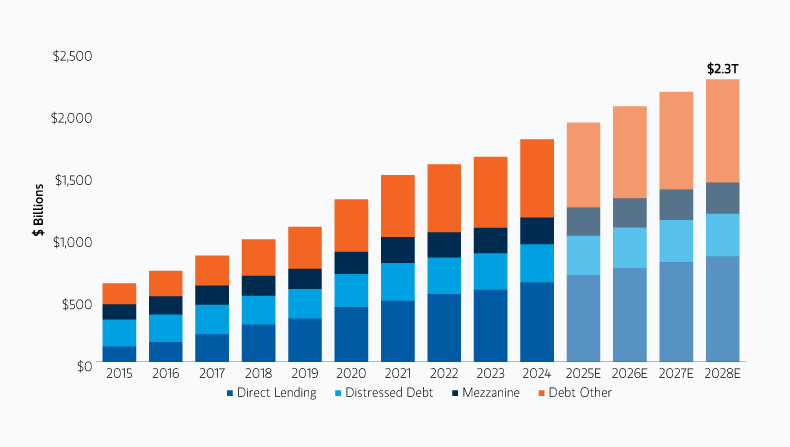
Projected and historic growth in private assets

DISPLAY 1
insight_evolution-of-direct-lending_display-1.png

Source: PitchBook. Historical AUM and forecasts generated on April 19, 2024.

The middle market represents a significant cross-section of the US economy, accounting for one-third of private sector GDP, $13 trillion in revenue and 50 million workers employed.4 Despite this, banks have largely withdrawn from the middle market as they have grown larger via consolidation and more constrained with their lending due to the flood of regulations post the Great Financial Crisis.

Other growth drivers for the industry include the $1.7 trillion of dry powder that the Private Equity industry has amassed while awaiting a better dealmaking environment.5 Direct Lending has a strong presence in the leveraged buyout loan market with its share rising to as high as 93% in 2023.6 In addition, nearly $1 trillion in middle market loans are scheduled to come due by 2030, which can drive significant refinancing activity for direct lenders.7

Investor demand for Direct Lending funds remains strong, underpinned by a higher-for-longer interest rate environment. Direct Lending funds have generated superior performance relative to both high-yield bonds and syndicated loans during seven periods of rising rates since 2009.8 Annualized returns divided by volatility, or Sharpe ratio, was also superior for Direct Lending relative to these two asset classes.9 This has not been lost on investors. Surveyed investors have cited Private Debt most frequently as the private asset class they intend to allocate more to.

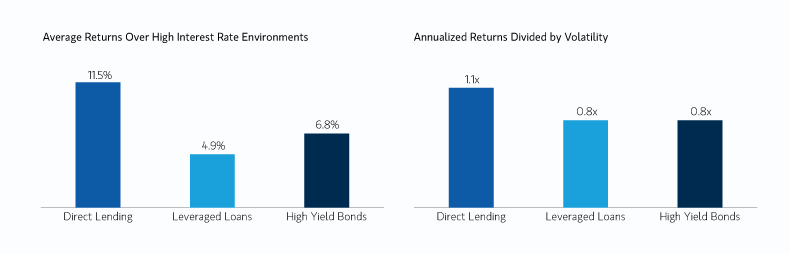
Direct Lending, Leveraged Loans, High Yield Bond Return Comparisons

DISPLAY 2
insight_evolution-of-direct-lending_display-4.png

Source: “Direct Lending” is represented by the Cliffwater Direct Lending Index (CDLI) and is calculated from quarterly data, which has been annualized. “Leveraged Loans” is represented by the Morningstar LSTA U.S. Leveraged Loan Index calculated from annualized monthly data. “High Yield Bonds” is represented by the ICE BofA High Yield Index calculated from annualized monthly data. High-rate environments are defined as periods of uninterrupted monthly increases in the 10-year US Treasury yield of 75 basis points or more. Return comparisons are based on the average of annualized monthly returns during seven such periods between 4Q’08 and 1Q’23. Volatility is measured using the standard deviation of annualized monthly returns. Ratios are based on the average of all monthly data between Q1’08 and Q4’22.

Learn more about the rise of direct lending from its small, early origins to its present role as a mainstay of the private credit industry.


1 Source: PitchBook, March 31, 2024.
2 Source: FDIC, as of December 31, 2023. Data from 2000 to 2023, measured by number of FDIC-insured banks.
3 Source: PitchBook LCD and S&P Credit Pro. Default rates based on the cumulative total of defaults between 1998 and 2023 on broadly syndicated institutional loans (12,223 issuers). Loss rate is calculated using the following formula: Loss Rate = Default Rate x (1 – Recovery Rate). Recovery rate data based on cumulative recovery on defaulted loans in the broadly syndicated institutional market between 1995 and 2023. 
4 Source: J.P. Morgan, Next Street, “The Middle Matters: Exploring the Diverse Middle Market Business Landscape.”
5 Source: PitchBook, as of June 30, 2024.
6 Source: Pitchbook LCD Data, as of September 30, 2024.
7 Source: LESG LPC and Morgan Stanley Research. Represents combined total of BDC and syndicated middle market loan maturities.
8 Source: “Direct Lending” is represented by the Cliffwater Direct Lending Index (CDLI) and is calculated from quarterly data, which has been annualized. “Leveraged Loans” is represented by the Morningstar LSTA U.S. Leveraged Loan Index calculated from annualized monthly data. “High Yield Bonds” is represented by the ICE BofA High Yield Index calculated from annualized monthly data. High-rate environments are defined as periods of uninterrupted monthly increases in the 10-year US Treasury yield of 75 basis points or more. Return comparisons are based on the average of annualized monthly returns during seven such periods between 4Q’08 and 1Q’23. Volatility is measured using the standard deviation of annualized monthly returns. Ratios are based on the average of all monthly data between Q1’08 and Q4’22.
9 Preqin Global 2023 Report: Private Debt, January 1, 2023.

DEFINITIONS:

Cliffwater Direct Lending Index (CDLI) seeks to measure the unlevered, gross of fee performance of U.S. middle-market corporate loans, as represented by the asset- weighted performance of the underlying assets of Business Development Companies (BDCs), including both exchange-traded and unlisted BDCs, subject to certain eligibility requirements.

Earnings Before Interest, Taxes, Depreciation and Amortization (EBITDA) is essentially net income with interest, taxes, depreciation, and amortization added back to it, and can be used to analyze and compare profitability between companies and industries because it eliminates the effects of financing and accounting decisions.

First Lien (also referred to as senior debt) is secured debt with first priority lien on borrower assets.

Gross Domestic Product (GDP) is the monetary value of all the finished goods and services produced within a country's borders in a specific time period. It includes all private and public consumption, government outlays, investments and net exports.

Leveraged Loan is a loan provided to issues who already have high levels of debt.

Middle-Market Companies, in general, generate annual EBITDA in the range of approximately $15 million to $100 million.

Sharpe ratio is a risk-adjusted measure calculated as the ratio of excess return to standard deviation. The Sharpe ratio determines reward per unit of risk. The higher the Sharpe ratio, the better the historical risk-adjusted performance.

Unitranche is a hybrid loan structure that combines senior and subordinated debt.

IMPORTANT INFORMATION

The views and opinions are those of the author as of the date of publication and are subject to change at any time due to market or economic conditions and may not necessarily come to pass. The views expressed do not reflect the opinions of all investment personnel at Morgan Stanley Investment Management (MSIM) and its subsidiaries and affiliates (collectively the Firm”), and may not be reflected in all the strategies and products that the Firm offers.

This material is for the benefit of persons whom the Firm reasonably believes it is permitted to communicate to and should not be forwarded to any other person without the consent of the Firm. It is not addressed to any other person and may not be used by them for any purpose whatsoever. It is the responsibility of every person reading this material to fully observe the laws of any relevant country, including obtaining any governmental or other consent which may be required or observing any other formality which needs to be observed in that country.

This material is a general communication, which is not impartial, is for informational and educational purposes only, not a recommendation to purchase or sell specific securities, or to adopt any particular investment strategy. Information does not address financial objectives, situation or specific needs of individual investors.

Any charts and graphs provided are for illustrative purposes only. Any performance quoted represents past performance. Past performance does not guarantee future results. All investments involve risks, including the possible loss of principal.

For the complete content and important disclosures, refer to the article pdf.