


KEY POINTS
1. The 60/40 portfolio experienced a rollercoaster ride, down 17.5% in 2022 and up 17.2% in 2023. 1
2. Whenever U.S. inflation exceeded 2.4%, there was an increase in the median correlation between stock and bond returns.
3. Two hundred years of historical analysis suggests there is an 80% probability of positive returns in the two years following a year of negative returns for both stocks and bonds.
The 60/40 portfolio, defined here as a mix of 60% U.S. equities and 40% U.S. Treasury bonds1, experienced a rollercoaster ride, dipping 17.5% in 2022 and rising 17.2% in 2023. Many market participants, perhaps fueled by a recency bias2 belief that the declines of 2022 would persist, questioned the value of the traditional strategy. In our view, those concerns were overstated.
Since 2000, bonds often offered an effective hedge against equity-led losses. However, this dynamic dramatically changed in 2022 when both bonds and stocks produced negative returns, resulting in the worst performance of the 60/40 portfolio since 1937.
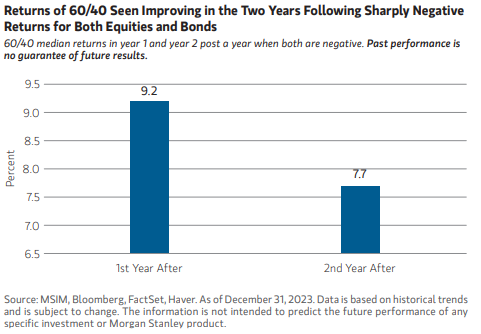
A unique set of circumstances led to the challenging 2022 macro conditions, and we had predicted that the 60/40 strategy would rebound. Two-hundred years of historical analysis suggests there is an 80% probability of positive returns in the two years following a year of negative returns for both stocks and bonds. Last year, stocks surged with the S&P, gaining 26.3%, and U.S. 10-year treasuries rose 3.6%. As a result, the 60/40 mix returned 17.2%, far above its historical annual median return of +7.8%.
Analyzing the data reveals inflation has been the most important driver of the correlation between stocks and bonds: whenever U.S. inflation exceeded 2.4%, there was an increase in the median correlation between stock and bond returns. We believe that a drop in inflation in 2024 will lead to lower correlation between stocks and bonds, increasing the diversification benefits and lowering downside risk. Moreover, our analysis of second-year returns following a year when both asset classes yielded a negative return, like in 2022, indicates a likelihood of positive returns for this combination in 2024.
Bottom Line:
We believe this broader contextual analysis, drawing on 200 years of data, provides a valuable roadmap for investors to consider the benefits of a 60/40 portfolio. Despite some skepticism following the challenges of 2022, we believe a 60/40 strategy remains relevant.
1U.S. equities are represented by the S&P 500 Total Return Index (1926-Present) and the U.S. Market Total Return index (1820-1925), with data provided by Global Financial Data (GFD); U.S. Bonds are represented by 10-year U.S. Treasury Total Returns (1820-Present), with data provided by GFD. Index definitions can be found in the disclosure section. The indexes do not include any expenses, fees or sales charges, which would lower performance. The index is unmanaged and should not be considered an investment. It is not possible to invest directly in an index.
2Recency bias is making decisions based on recent events, expecting that those events will persist in the future.
Featured Insights


Risk Considerations
There is no assurance that a portfolio will achieve its investment objective. Portfolios are subject to market risk, which is the possibility that the market values of securities owned by the portfolio will decline and that the value of portfolio shares may therefore be less than what you paid for them. Asset allocation/Diversification does not protect you against a loss in a particular market; however it allows you to spread that risk across various asset classes. In general, equities securities' values fluctuate in response to activities specific to a company. Fixed income securities are subject to the ability of an issuer to make timely principal and interest payments (credit risk), changes in interest rates (interest-rate risk), the creditworthiness of the issuer and general market liquidity (market risk). In a rising interest-rate environment, bond prices may fall and may result in periods of volatility and increased portfolio redemptions. In a declining interest-rate environment, the portfolio may generate less income. Longer-term securities may be more sensitive to interest rate change.
The S&P 500® Index measures the performance of the large cap segment of the U.S. equities market, covering approximately 75% of the U.S. equities market. The Index includes 500 leading companies in leading industries of the U.S. economy.
Past performance is no guarantee of future results.
The views and opinions and/or analysis expressed are those of the author or the investment team as of the date of preparation of this material and are subject to change at any time without notice due to market or economic conditions and may not necessarily come to pass. Furthermore, the views will not be updated or otherwise revised to reflect information that subsequently becomes available or circumstances existing, or changes occurring, after the date of publication. The views expressed do not reflect the opinions of all investment personnel at Morgan Stanley Investment Management (MSIM) and its subsidiaries and affiliates (collectively “the Firm”), and may not be reflected in all the strategies and products that the Firm offers.
Forecasts and/or estimates provided herein are subject to change and may not actually come to pass. Information regarding expected market returns and market outlooks is based on the research, analysis and opinions of the authors or the investment team. These conclusions are speculative in nature, may not come to pass and are not intended to predict the future performance of any specific strategy or product the Firm offers. Future results may differ significantly depending on factors such as changes in securities or financial markets or general economic conditions.
This material has been prepared on the basis of publicly available information, internally developed data and other third-party sources believed to be reliable. However, no assurances are provided regarding the reliability of such information and the Firm has not sought to independently verify information taken from public and third-party sources.
This material is a general communication, which is not impartial and all information provided has been prepared solely for informational and educational purposes and does not constitute an offer or a recommendation to buy or sell any particular security or to adopt any specific investment strategy. The information herein has not been based on a consideration of any individual investor circumstances and is not investment advice, nor should it be construed in any way as tax, accounting, legal or regulatory advice. To that end, investors should seek independent legal and financial advice, including advice as to tax consequences, before making any investment decision.
Charts and graphs provided herein are for illustrative purposes only. Past performance is no guarantee of future results. The indexes are unmanaged and do not include any expenses, fees or sales charges. It is not possible to invest directly in an index. Any index referred to herein is the intellectual property (including registered trademarks) of the applicable licensor. Any product based on an index is in no way sponsored, endorsed, sold or promoted by the applicable licensor and it shall not have any liability with respect thereto.