


Following the Federal Reserve's half-point cut in interest rates, we expect the healthy yields recently enjoyed from "risk-free" assets1 may begin to decline. We think this creates an opportune time to take a deeper look at the advantages of dividend-paying stocks.
While the cohort of highest-yielding equities initially may appear attractive, we find they are often associated with higher payout ratios and lower future growth prospects than some of their more moderate-yielding counterparts. In our experience, however, companies that can consistently grow their dividends tend to exhibit attractive characteristics, such as resilient earnings growth, higher return on equity and attractive long-term performance. With that in mind, now seems like a good time to revisit the key benefits of a dividend growth strategy.
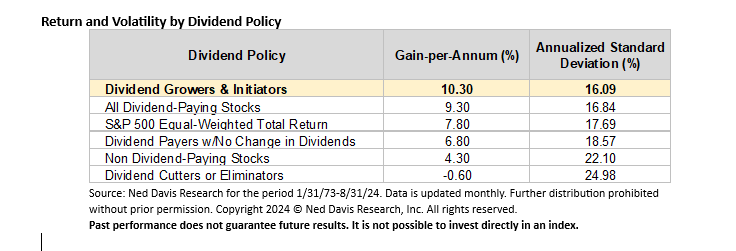
Compelling long-term performance: A look at data provided by Ned Davis demonstrates that dividend growers and initiators have compounded at an average annualized rate of 10.34% from January 1, 1973, to August 31, 2024, outpacing the equal-weighted S&P 500 index which returned 7.82% over the same time period.
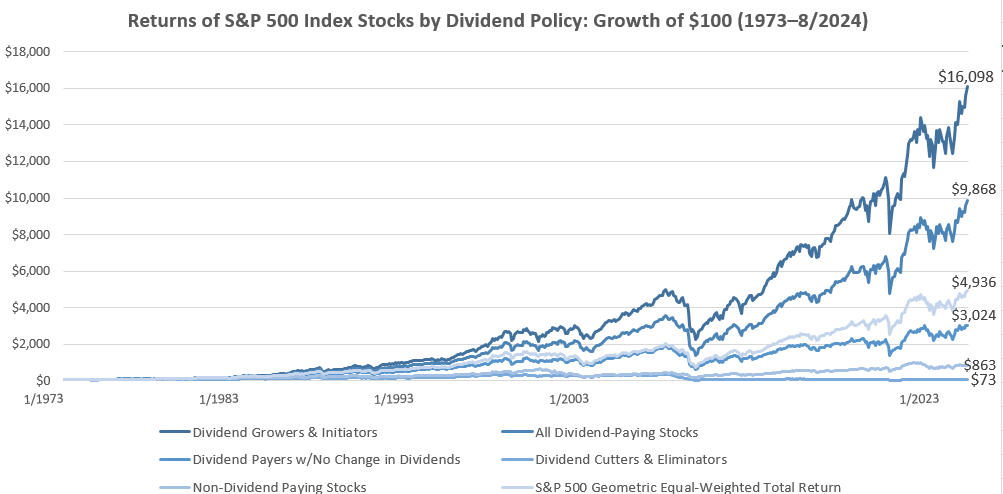
Source: Ned Davis Research for the period 1/31/73-8/31/24. Data is updated monthly. Further distribution prohibited without prior permission. Copyright 2024 © Ned Davis Research, Inc. All rights reserved.Past performance does not guarantee future results. It is not possible to invest directly in an index.
Lower Volatility: In addition to providing the highest average annualized rate of return over the last 50 years, dividend growers and initiators have displayed the lowest standard deviation,2 a measure of risk, relative to companies that cut or do not grow their dividend, as well as non-payers and the equal- weighted S&P 500.
Income: As products and services increase in price due to inflation, a company's revenue and potentially its earnings and dividends will increase as well. By collecting a part of those earnings through a dividend, investors can better protect their purchasing power with the income stream dividends provide. Typically paid either monthly or quarterly, investors can choose to reinvest that dividend or receive distributions to fund their lifestyle.
Why now?
As interest rates and bond yields move lower, dividend-paying equities become more attractive as their relative yield increases. As shown below, within the S&P 500, dividend growers and initiators historically have outperformed other dividend payers and non-dividend payers over a range of three months to 36 months, on average, following interest rate cuts.
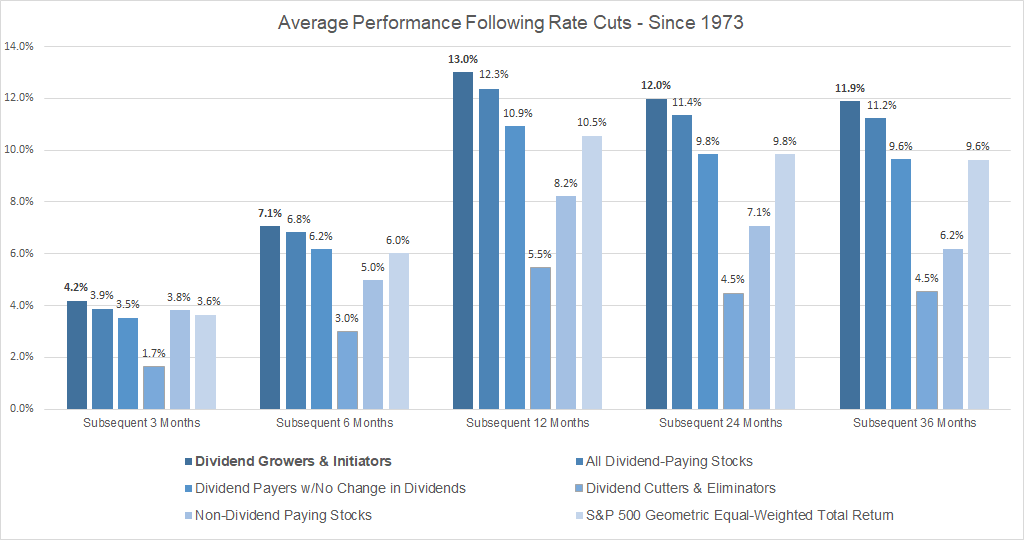
Source: Ned Davis Research for the period 1/31/73-8/31/24. Data is updated monthly. Further distribution prohibited without prior permission. Copyright 2024 © Ned Davis Research, Inc. All rights reserved. Note: Reflects Bloomberg Fed. Funds Upper Limit Target (FDTR) from 1973-2024 and represent 95 rate cuts through 8/31/24. Fed Cut defined when FDTR month/month change is negative. 3-month and 6-month change is cumulative, while 12-month, 24-month, and 36-month, is annualized. Past performance does not guarantee future results. It is not possible to invest directly in an index.
Simply stated, the combination of growth, income and moderate stability may make a dividend growth strategy an attractive option for long-term investors. With the Fed's recent aggressive interest rate cut—and more cuts anticipated for this year—investors may be looking for alternative sources of yield. We believe now is a key time to consider a dividend investment strategy.
Bottom line: Falling interest rates may curb the yield and income from various fixed income assets, making dividend-growing stocks, an attractive portfolio option, even more compelling as the Fed pursues a rate-lowering path.
Disclosures:
Dividend Policy Description: The performance of each group is based on the equal-weighted geometric average of dividend-paying and non-dividend-paying historical S&P 500 stocks, rebalanced monthly. Each stock's dividend policy is determined on a rolling 12-month basis. For example, a stock is classified as dividend-paying if it paid a cash dividend at any time during the previous 12 months. A stock is reclassified only if its dividend payments change. Dividend growers and initiators include stocks that raised their existing dividend or initiated a new dividend during the preceding 12 months. Dividend cutters or eliminators include stocks that lowered their existing dividend or stopped paying regular dividends during the preceding 12 months. The returns do not reflect the deduction of any fees, expenses or taxes that would reduce performance in an actual client portfolio. Returns for stocks that paid dividends assume reinvestment of all income. The periods shown do not represent the full history of the S&P 500; it is the history maintained by the data source. It is not possible to invest in an index. These groups have been determined by Ned Davis Research, Inc. Further distribution of this information is prohibited without prior permission. Copyright 2024 © Ned Davis Research, Inc. All rights reserved.
S&P 500 is a stock market-capitalization weighted index tracking the stock performance of 500 of the largest U.S. companies.
1A risk-free asset is a term broadly used to describe a security that has a guaranteed future return and very little possibility of loss. Debt obligations issued by the U.S. Department of the Treasury (bonds, notes, and especially Treasury bills) are considered to be risk-free because the "full faith and credit" of the U.S. government backs them.
2 Standard deviation is a measure of risk that helps determine market volatility or the spread of asset prices from their average price. When prices move broadly, standard deviation is high, meaning an investment will be risky.
Featured Products
Featured Insights


Risk Considerations: The value of investments may increase or decrease in response to economic and financial events (whether real, expected or perceived) in the U.S. and global markets. The value of equity securities is sensitive to stock market volatility. Changes in the dividend policies of companies could make it difficult to provide a predictable level of income.
The views and opinions and/or analysis expressed are those of the author or the investment team as of the date of preparation of this material and are subject to change at any time without notice due to market or economic conditions and may not necessarily come to pass. Furthermore, the views will not be updated or otherwise revised to reflect information that subsequently becomes available or circumstances existing, or changes occurring, after the date of publication. The views expressed do not reflect the opinions of all investment personnel at Morgan Stanley Investment Management (MSIM) and its subsidiaries and affiliates (collectively “the Firm”), and may not be reflected in all the strategies and products that the Firm offers.
Forecasts and/or estimates provided herein are subject to change and may not actually come to pass. Information regarding expected market returns and market outlooks is based on the research, analysis and opinions of the authors or the investment team. These conclusions are speculative in nature, may not come to pass and are not intended to predict the future performance of any specific strategy or product the Firm offers. Future results may differ significantly depending on factors such as changes in securities or financial markets or general economic conditions.
This material has been prepared on the basis of publicly available information, internally developed data and other third-party sources believed to be reliable. However, no assurances are provided regarding the reliability of such information and the Firm has not sought to independently verify information taken from public and third-party sources.
This material is a general communication, which is not impartial and all information provided has been prepared solely for informational and educational purposes and does not constitute an offer or a recommendation to buy or sell any particular security or to adopt any specific investment strategy. The information herein has not been based on a consideration of any individual investor circumstances and is not investment advice, nor should it be construed in any way as tax, accounting, legal or regulatory advice. To that end, investors should seek independent legal and financial advice, including advice as to tax consequences, before making any investment decision.
Charts and graphs provided herein are for illustrative purposes only. Past performance is no guarantee of future results. The indexes are unmanaged and do not include any expenses, fees or sales charges. It is not possible to invest directly in an index. Any index referred to herein is the intellectual property (including registered trademarks) of the applicable licensor. Any product based on an index is in no way sponsored, endorsed, sold or promoted by the applicable licensor and it shall not have any liability with respect thereto.