


The brackets of March Madness can consume both diehard fans and casual followers of college basketball. Old rivalries are stoked, and friendly wagers are made among friends, neighbors and coworkers. This annual rite of spring seems perfectly timed to set a cheerful tone—it may even be therapeutic. Just a few weeks after the tournament concludes, a different set of brackets takes center stage in the lives of U.S. taxpayers.
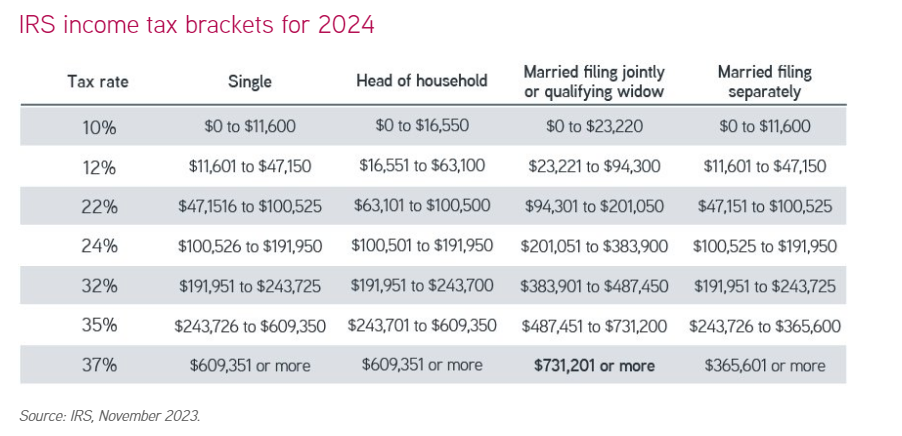
To prepare for the potential letdown, every November the Internal Revenue Service (IRS) announces the new tax brackets for the following year. Here are the new brackets for tax year 2024, for the income tax returns taxpayers will file by April 2025.
How tax brackets evolved
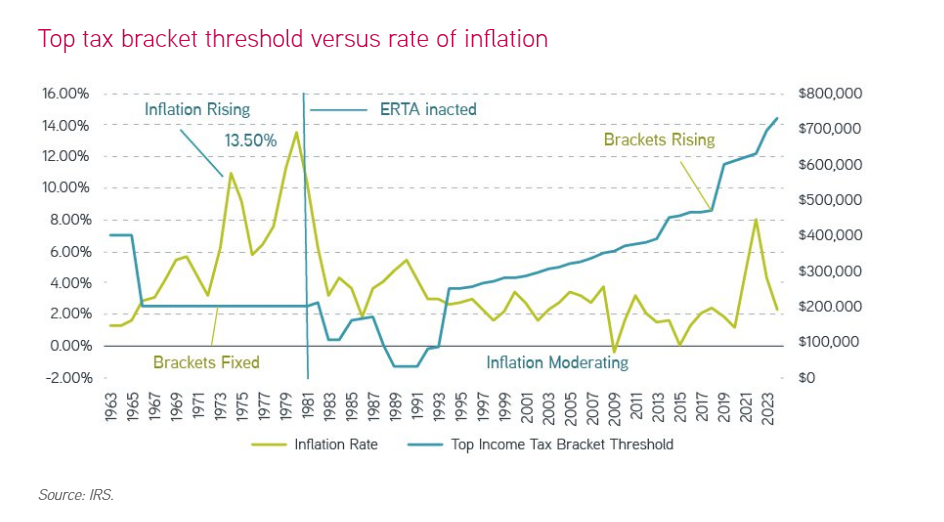
Before 1981, tax brackets were fixed for 25 consecutive years. Bracket creep became a dynamic where increases in wages pushed more taxpayers into higher marginal tax rates while high inflation rates were eroding the purchasing power of their remaining dollars.
The Economic Recovery Tax Act of 1981 (ERTA) was intended to address bracket creep by requiring that key elements of the tax system be indexed for inflation. Federal law now mandates that tax brackets adjust each year for inflation. With the high inflation rates of the past two years, tax brackets have been steadily shifted upwards. In 2023, bracket thresholds increased by 7% from 2022, and in 2024, thresholds rose another 5.40% across the board.
To see how this dynamic played out, consider that in the 1970s, inflation was particularly high, rising by 1980 to 13.5%—a rate not seen since the end of World War II. After ERTA, many U.S. taxpayers benefited from both rising wages and tax brackets adjusting to moderate rates of inflation.
Bracket creep did not end there, however. ERTA had addressed only one variable, inflation. By tinkering with the number of tax brackets, legislators could theoretically capture similar or even greater amounts of tax revenue.
In the 1960s and 1970s, there were as many as 26 tax brackets, reaching the highest rate of 91%. Yet few people fell into that top bracket with a threshold income of $400,000 in 1963. That's equivalent to a little over $4 million in today's dollars.
In the 2024 bracket release from the IRS, only seven tax brackets remain with a top rate of 37% for those married filing jointly with a threshold income of $731,201. Even though today's top tax rate is much lower, far more households reach that threshold.
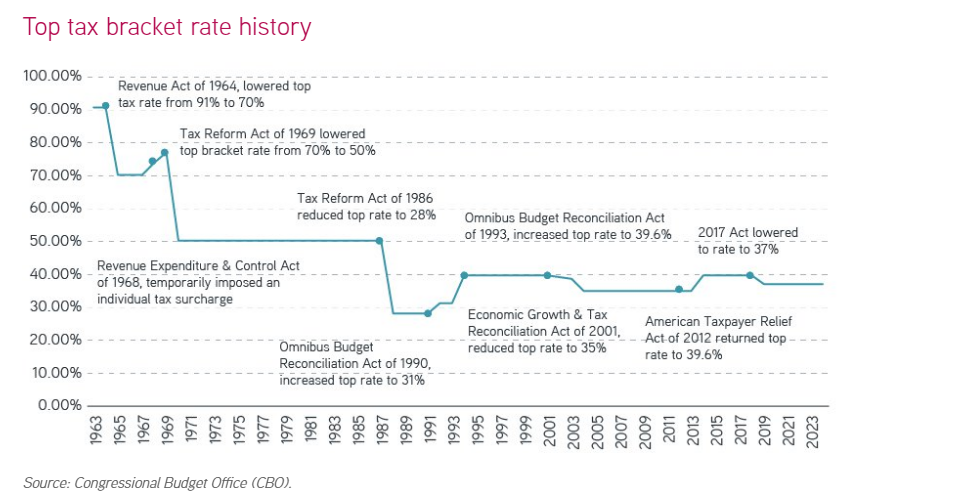
Another important milestone is the Tax Reform Act of 1986 (TRA-86). With this legislation, Congress reduced the top income tax rate from 50% to 28% and cut the number of tax brackets from 15 to five, while widening the bracket range to put more households at the top tax rate.
Introducing taxes on long-term capital gains
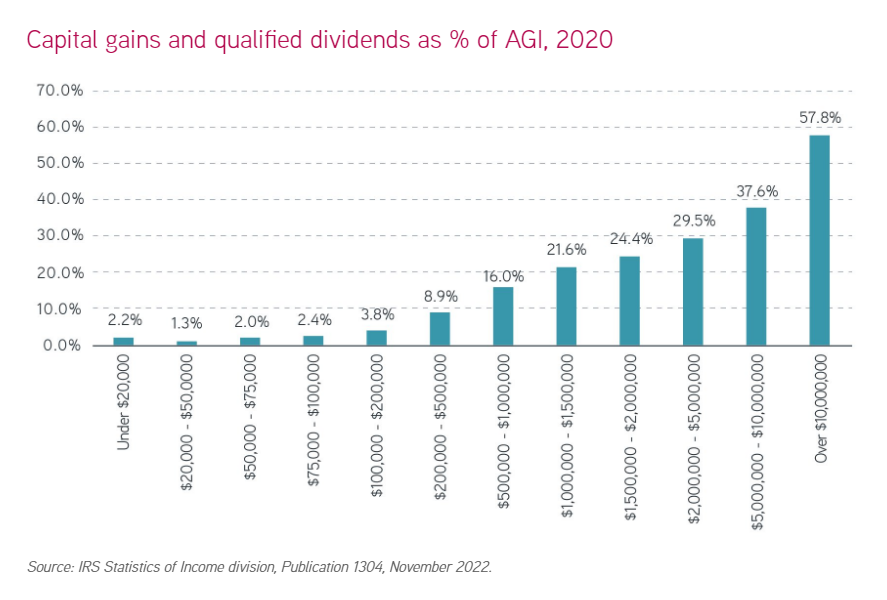
The most impactful change of the TRA-86 was how it modified the taxation of capital gains. Until 1986, up to 60% of long-term capital gains could be excluded from a taxpayer's Adjusted Gross Income (AGI). At the time, the average holding period for stocks was roughly seven years, so most capital gains were long term.
By removing that exclusion, TRA-86 captured a much greater proportion of income from the highest earners. From the latest IRS data available, as income rises, capital gains and dividends comprise a growing percentage of a taxpayer's AGI.
Eliminating the capital gains exclusion helped to motivate the idea that managing portfolios for tax efficiency could offer investors a source of previously untapped alpha—tax alpha. At the same time, advancements in computer technology during the late 1980s and early 1990s, along with academic research supporting the value add of tax-loss harvesting, ultimately led to the creation of direct indexing portfolios.
Outlook for a U.S. presidential election year
With that historical perspective in mind, let's assess upcoming issues in tax legislation. This year's presidential election looms large in determining future tax policy. The timing is particularly important, because the new president will face the scheduled expiration of most individual income tax provisions in the 2017 Tax Cuts and Jobs Act (TCJA) soon after the inauguration.
With this expiration, the top tax rate would revert to 39.6% from 37%, while the threshold for the top bracket would fall back to the 2017 level of $470,700 (married filing jointly), or $553,600 when indexed for inflation. So more taxpayers would find themselves in the top tax bracket facing a higher tax rate.
A largely overlooked change in the TCJA was to link the tax bracket adjustment to the chained consumer price index (CPI) instead of the traditional CPI. Chained CPI attempts to capture consumption choices as prices rise. If the cost of apples increases, for example, consumers may switch to pears, so that choice can blunt the impact of inflation. Traditional CPI simply measures the rise in the cost of apples, so the estimate of inflation tends to be higher.
Switching to a lower estimate of inflation using the chained CPI calculation methodology results in tax brackets growing more slowly in the future—exacerbating the bracket creep. As taxpayers with steadily rising incomes get close to reaching the threshold, they will be bumped into the next bracket sooner. This change isn't scheduled to expire in 2025.
Bottom line
Tax law changes tend to follow a pattern of give and take—for every increase or decrease in one aspect of tax policy, we expect to see an offsetting decrease or increase in another aspect. Depending on the outcome of the U.S. presidential election, a potential trade-off dynamic to watch for could be that some TCJA provisions are extended or made permanent, while other proposals would raise taxes on capital gains by as much as 5% across the board.
Staying ahead of the ever-creeping April brackets requires vigilance, planning and fiscal agility that may be comparable to the athletic ability of elite college basketball players. Time will tell how these brackets play out.

Parametric and Morgan Stanley do not provide legal, tax or accounting advice or services. Clients should consult with their own tax or legal advisor prior to entering into any transaction or strategy.
The views and opinions and/or analysis expressed are those of the author or the investment team as of the date of preparation of this material and are subject to change at any time without notice due to market or economic conditions and may not necessarily come to pass. Furthermore, the views will not be updated or otherwise revised to reflect information that subsequently becomes available or circumstances existing, or changes occurring, after the date of publication. The views expressed do not reflect the opinions of all investment personnel at Morgan Stanley Investment Management (MSIM) and its subsidiaries and affiliates (collectively “the Firm”), and may not be reflected in all the strategies and products that the Firm offers.
Forecasts and/or estimates provided herein are subject to change and may not actually come to pass. Information regarding expected market returns and market outlooks is based on the research, analysis and opinions of the authors or the investment team. These conclusions are speculative in nature, may not come to pass and are not intended to predict the future performance of any specific strategy or product the Firm offers. Future results may differ significantly depending on factors such as changes in securities or financial markets or general economic conditions.
This material has been prepared on the basis of publicly available information, internally developed data and other third-party sources believed to be reliable. However, no assurances are provided regarding the reliability of such information and the Firm has not sought to independently verify information taken from public and third-party sources.
This material is a general communication, which is not impartial and all information provided has been prepared solely for informational and educational purposes and does not constitute an offer or a recommendation to buy or sell any particular security or to adopt any specific investment strategy. The information herein has not been based on a consideration of any individual investor circumstances and is not investment advice, nor should it be construed in any way as tax, accounting, legal or regulatory advice. To that end, investors should seek independent legal and financial advice, including advice as to tax consequences, before making any investment decision.
Charts and graphs provided herein are for illustrative purposes only. Past performance is no guarantee of future results. The indexes are unmanaged and do not include any expenses, fees or sales charges. It is not possible to invest directly in an index. Any index referred to herein is the intellectual property (including registered trademarks) of the applicable licensor. Any product based on an index is in no way sponsored, endorsed, sold or promoted by the applicable licensor and it shall not have any liability with respect thereto.