


KEY POINTS
1. From 2018 to Q1 2024, the Russell 1000® Index saw reduced weighted carbon intensity of almost 50%, based on Scope 1 and 2 emissions. On the other hand, weighted absolute emissions—the measure that matters most in achieving Net Zero—remained essentially flat.
2. The rising market share of the Mag 7, coupled with their favorable Scope 1 and 2 carbon emissions profiles, contributed to that decarbonization progress. We wanted to measure the degree of their impact on the Russell 1000's decarbonization.
3. We found that Scope 1 and 2 account for only a small portion of the Mag 7's total carbon emissions. Ultimately, a complete measure of emissions needs to include Scope 3.
4. Yet, Scope 3 data is inconsistent and underreported, creating a barrier to its inclusion. This is an ongoing, critical issue for climate-focused investors who want to evaluate the sources of a company's carbon emissions and construct low-carbon portfolios.
"Magnificent 7" (Mag 7) stocks—Alphabet, Amazon, Apple, Meta Platforms, Microsoft, Nvidia and Tesla—together made up more than 25% of the Russell 1000® as of March 31, doubling their market share since 2018. In addition to benefiting from the momentum of AI, they have strong business models that support growth.
Scoping out emissions data
Collectively, the Mag 7's relatively low Scope 1 and 2 emissions benefit the Russell 1000's decarbonization path. However, our research shows most Mag 7 carbon emissions are found in their supply chains, categorized under Scope 3, rather than in their direct business operations. We manually collect this data from each company's official sustainability report to offset any data lags from the vendor's feed.
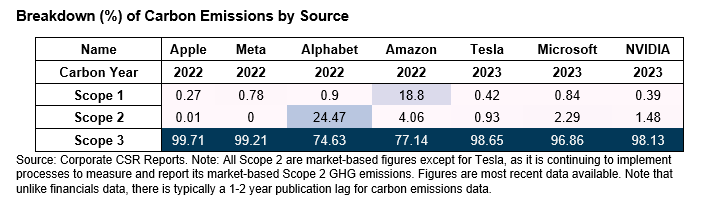
Most decarbonized portfolios are based solely on Scope 1 and 2 emissions since reliable Scope 3 estimates and good quality data are still being developed. Mag 7 companies generally collect and provide higher-quality Scope 3 data than their peers. However, we excluded these from our core analysis as many Russell 1000 companies either don't report Scope 3 emissions or only report certain categories, which could potentially distort the findings.
Measuring Russell 1000 decarbonization
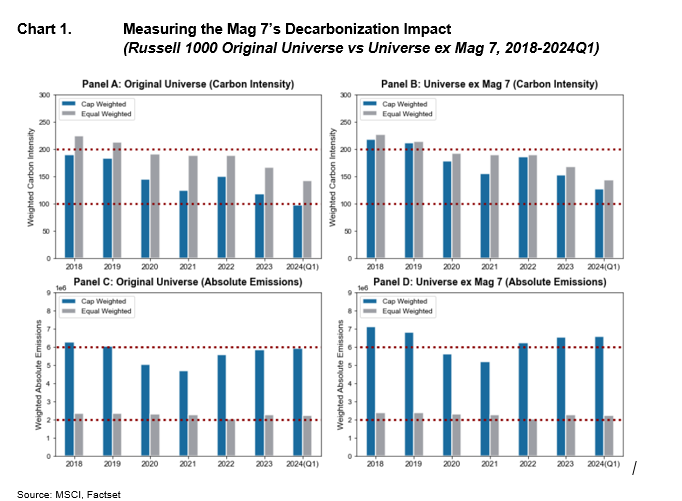
First, we need an overall picture of the Russell 1000's Scope 1 and 2 emissions. In Chart 1 below, we show the portfolio-weighted carbon intensity and absolute emissions of the Russell 1000 from 2018 to Q1 2024 in Panel A and C, respectively. To control for capitalization bias, we used not only the original index weight, but also an equal-weight measure.
Note that both cap- and equal-weighted carbon intensity generally decrease over the years. However, the equal-weighted analytics are all higher (less favorable) than their cap-weighted counterparts. This raises the question of whether some large-cap, low carbon-intensive names, such as the Mag 7, are impacting the results.
On the other hand, weighted absolute emissions appear to be relatively flat year-over-year, with cap-weighted analytics dominating the equal-weighted ones. The discrepancy between cap-weighed and equal-weighted absolute emissions is clearly more prominent than that of carbon intensity. We want to highlight that regardless of the Russell 1000's decreasing weighted carbon intensity over this time period, it is absolute carbon emissions that matter most toward Net Zero goals.
Analyzing the Mag 7's role
To analyze the Mag 7's role, we evaluated weighted carbon intensity and absolute emissions of the Russell 1000 without the Mag 7 using Scope 1&2 carbon data in Panel B and D, respectively. Not surprisingly, we found that the Russell 1000 ex Mag 7 has higher cap-weighted carbon intensity and absolute emissions than the original universe. Conversely, equal-weighted absolute emissions are uniform between both universes with and without the Mag 7, providing more indirect evidence of the Mag 7's effect.
Why move toward decarbonization and Net Zero?
Companies actively pursuing a low carbon footprint may be better equipped to meet regulatory requirements, increase their appeal to consumers and investors and avoid some of the financial pitfalls associated with higher-carbon industries. By creating portfolios that prioritize a low carbon profile, investors contribute to a more resilient and sustainable economy, while gaining the potential for long-term value creation.
Bottom line: The Russell 1000 has decarbonized nearly 50% over the past six to seven years, based on Scope 1 and 2 carbon intensity, although weighted absolute carbon emissions remained essentially flat. Our research indicates the Mag 7, with their outsized market share and favorable Scope 1 and 2 emissions, have played a significant role in that trend.
Yet, our research indicates that to fully assess a company's total carbon emissions, Scope 3 supply chain data is essential in order for investors to assess the true impact of a company's decarbonization efforts. However, unlike the Mag 7, many companies lack high-quality Scope 3 data.
Looking ahead, we expect to see a big lift in the collection and granularity of Scope 3 data, facilitated by the growth of AI computing and more data centers. For example, Microsoft increased its reported Scope 3 data by 30.9% as of December 31, 2023, from a 2020 baseline, largely due to the construction of new data centers. We think it's essential for investors collectively to encourage companies to collect and disclose Scope 3 data to fully evaluate their carbon footprint.
DEFINITIONS
Net Zero is a collective goal aimed at balancing GHG emissions with their removal from the atmosphere (to achieve "net zero") by a specified year, such as 2050. Many governments, companies, cities, NGOs and financial institutions are signatories to this pledge through the Paris Agreement and other international efforts.
Scope 1 emissions are a company's direct emissions.
Scope 2 emissions are indirect emissions generated from a company's purchased energy, such as electricity.
Scope 3 emissions are indirect emissions generated from a company's value chain. Scope 3 emissions consist of two categories—upstream and downstream activities—and 15 subcategories. Upstream emissions are generated from inputs to the production process, such as purchased goods, waste generation and leased assets. Downstream emissions are generated from delivering and using the finished product or service provided, such as distribution, end-of-life disposal, and investments or loans.
Russell 1000® Index is unmanaged index of the 1,000 largest U.S. stocks. Unless otherwise stated, index returns do not reflect the effect of any applicable sales charges, commissions, expenses, taxes or leverage, as applicable. It is not possible to invest directly in an index.
Risk disclosure: ESG Strategies that incorporate impact investing and/or Environmental, Social and Governance (ESG) factors could result in relative investment performance deviating from other strategies or broad market benchmarks, depending on whether such sectors or investments are in or out of favor in the market. As a result, there is no assurance ESG strategies could result in more favorable investment performance.
See below for more important disclosures.
Featured Insights


The views and opinions and/or analysis expressed are those of the author or the investment team as of the date of preparation of this material and are subject to change at any time without notice due to market or economic conditions and may not necessarily come to pass. Furthermore, the views will not be updated or otherwise revised to reflect information that subsequently becomes available or circumstances existing, or changes occurring, after the date of publication. The views expressed do not reflect the opinions of all investment personnel at Morgan Stanley Investment Management (MSIM) and its subsidiaries and affiliates (collectively “the Firm”), and may not be reflected in all the strategies and products that the Firm offers.
Forecasts and/or estimates provided herein are subject to change and may not actually come to pass. Information regarding expected market returns and market outlooks is based on the research, analysis and opinions of the authors or the investment team. These conclusions are speculative in nature, may not come to pass and are not intended to predict the future performance of any specific strategy or product the Firm offers. Future results may differ significantly depending on factors such as changes in securities or financial markets or general economic conditions.
This material has been prepared on the basis of publicly available information, internally developed data and other third-party sources believed to be reliable. However, no assurances are provided regarding the reliability of such information and the Firm has not sought to independently verify information taken from public and third-party sources.
This material is a general communication, which is not impartial and all information provided has been prepared solely for informational and educational purposes and does not constitute an offer or a recommendation to buy or sell any particular security or to adopt any specific investment strategy. The information herein has not been based on a consideration of any individual investor circumstances and is not investment advice, nor should it be construed in any way as tax, accounting, legal or regulatory advice. To that end, investors should seek independent legal and financial advice, including advice as to tax consequences, before making any investment decision.
Charts and graphs provided herein are for illustrative purposes only. Past performance is no guarantee of future results. The indexes are unmanaged and do not include any expenses, fees or sales charges. It is not possible to invest directly in an index. Any index referred to herein is the intellectual property (including registered trademarks) of the applicable licensor. Any product based on an index is in no way sponsored, endorsed, sold or promoted by the applicable licensor and it shall not have any liability with respect thereto.