


Want to know how a given asset class is performing? Look at the headline return for its market index. The headline figure shows the weighted average of returns across the whole of a given market. But if your goal is to understand the return potential within that market, you'll have to dig deeper into the numbers behind that headline figure.
Performance on the Bloomberg U.S. Mortgage Backed Securities Index serves as a case in point. The index registered a modest 1.2% gain last year. However, when splitting performance out by bond coupon rates, we see wide performance dispersion. Returns spanned a nearly 630 basis point (bps) range, with higher coupon bonds posting higher returns and the lowest coupon bonds underperforming.
Higher coupons corresponded to higher returns in 2024
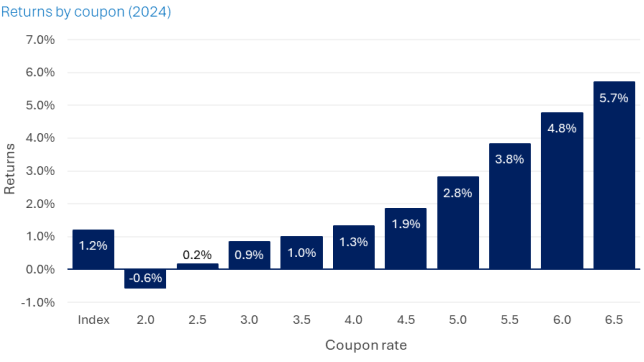
Source: Bloomberg, Morgan Stanley Investment Management. As of December 31, 2024. Index = Bloomberg U.S. Mortgage Backed Securities (MBS). Past performance is not a reliable indicator of future results. The index performance is provided for illustrative purposes only and is not meant to depict the performance of a specific investment.
What drove performance dispersion?
Performance headwinds were most acute later in the year, as easing by the U.S. Federal Reserve caused rates at the front end of the yield curve to fall alongside a rise in yields at the back end on higher inflation uncertainty and post-election fiscal policy concerns.
In this respect, key rate or partial duration, which measures bond sensitivity to changes in the shape of the yield curve, proves particularly useful for understanding how curve steepening played out across the coupon spectrum last year.
First, to illustrate why key rate duration matters for agency MBS bonds, consider how prepayments affect duration exposure at different points of the curve. In practice, higher rate mortgages packaged in a Fannie Mae 6.5% coupon bond are more likely to be prepaid as falling short-term rates spur refinancings. Consequently, the shorter weighted average life bond will be more sensitive to changes in two and five-year rates, as happened in 2024 when each accounted for 36% of partial duration (see table below).
A lower coupon 2.0% bond, on the other hand, would see minimal prepayments and find the bulk of its duration exposure (62% last year) at the 10-year point, with much less exposure at the front end.
Altogether, this meant that last year's curve steepening bore a performance cost to bonds with longer key rate durations as yields rose at the back end, whereas shorter duration bonds benefitted from falling front-end rates that resulted in higher overall returns.
Drilling down into duration
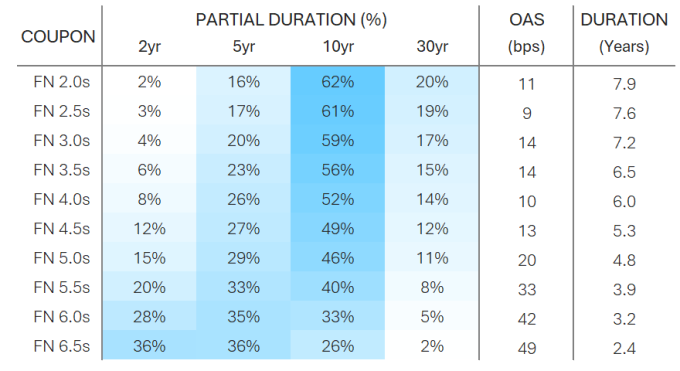
Source: Yield Book, Morgan Stanley Investment Management. As of December 31, 2024. Index = Bloomberg U.S. Mortgage Backed Securities (MBS). Past performance is not a reliable indicator of future results. For informational purposes and does not constitute an offer or a recommendation to buy or sell any particular security or to adopt any specific investment strategy.
Calling the curve
Clearly, the better the insight into duration exposure within the agency MBS market, the better able an investor will be to take positions on the curve that express their future rate expectations.
Buyers of higher coupon bonds, for instance, are implicitly positioned for a steepener. This could be a bull steepener on expectations of Fed rate cuts, or a bear steepener that foresees inflation staying higher for longer or the persistence of stubbornly high fiscal deficits. In contrast, positioning in lower coupon bonds implies an outlook for future flattening.
Pinpointing value
In addition to curve movements, agency MBS investors must carefully consider relative value. As the chart below shows, the option adjusted spread (OAS) is widest for higher coupon bonds and exhibits a general tightening trend going down the coupon continuum.
Notably, spreads are tightest for the lower coupon bonds that comprise the highest proportion of the index weighting. That likely reflects the Fed's role as a significant owner of these bonds, a factor that sustains tighter supply and technical support on spreads.
This isn't the case in the smaller-weighted, new production higher coupon segment. As such, these bonds not only appear more attractively priced than other parts of the market but also confer the potential for investors to earn higher income while taking lower duration risk.
Compared to other bond sectors, relative value looks inexpensive for agency MBS at the index-level. However, as we've seen, the majority of value comes from a small portion of the index that only an active manager can overweight.
Spreads widest for higher coupon bonds
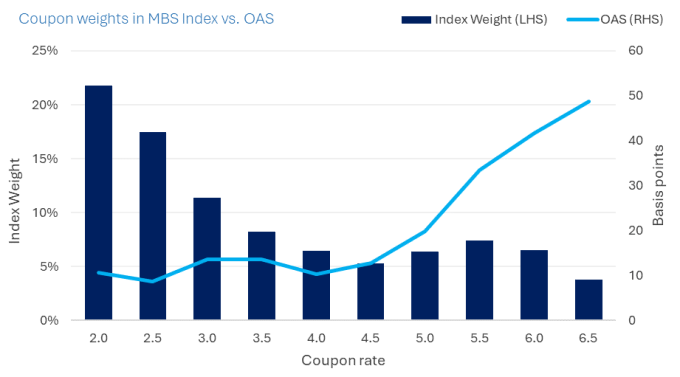
Source: Yield Book, Morgan Stanley Investment Management. As of December 31, 2024. Index = Bloomberg U.S. Mortgage Backed Securities (MBS). Past performance is not a reliable indicator of future results. The index performance is provided for illustrative purposes only and is not meant to depict the performance of a specific investment.
Bottom line - When it comes to the agency MBS market, headline index figures can conceal more than they reveal about actual investment potential within the sector. Taking a deeper look at returns, duration and index weights and the dynamics behind relative pricing are key for investors seeking to earn alpha in this market.
Bloomberg U.S. Mortgage-Backed Securities (MBS) Index measures agency mortgage-backed pass-through securities issued by GNMA, FNMA, and FHLMC.
A basis point is a unit of measure, equal to one hundredth of a percentage point, used in finance to describe the percentage change in the value or rate of a financial instrument.
Duration is a measure of the sensitivity of the price (the value of principal) of a fixed-income investment to a change in interest rates. Duration is expressed as a number of years. Rising interest rates mean falling bond prices, while declining interest rates mean rising bond prices.
"When it comes to the agency MBS market, headline index figures can conceal more than they reveal about actual investment potential within the sector."
Featured Insights


Disclaimer
Eaton Vance and Morgan Stanley do not provide legal, tax or accounting advice or services. Clients should consult with their own tax or legal advisor prior to entering into any transaction or strategy.
The views and opinions and/or analysis expressed are those of the author or the investment team as of the date of preparation of this material and are subject to change at any time without notice due to market or economic conditions and may not necessarily come to pass. Furthermore, the views will not be updated or otherwise revised to reflect information that subsequently becomes available or circumstances existing, or changes occurring, after the date of publication. The views expressed do not reflect the opinions of all investment personnel at Morgan Stanley Investment Management (MSIM) and its subsidiaries and affiliates (collectively “the Firm”), and may not be reflected in all the strategies and products that the Firm offers.
Forecasts and/or estimates provided herein are subject to change and may not actually come to pass. Information regarding expected market returns and market outlooks is based on the research, analysis and opinions of the authors or the investment team. These conclusions are speculative in nature, may not come to pass and are not intended to predict the future performance of any specific strategy or product the Firm offers. Future results may differ significantly depending on factors such as changes in securities or financial markets or general economic conditions.
This material has been prepared on the basis of publicly available information, internally developed data and other third-party sources believed to be reliable. However, no assurances are provided regarding the reliability of such information and the Firm has not sought to independently verify information taken from public and third-party sources.
This material is a general communication, which is not impartial and all information provided has been prepared solely for informational and educational purposes and does not constitute an offer or a recommendation to buy or sell any particular security or to adopt any specific investment strategy. The information herein has not been based on a consideration of any individual investor circumstances and is not investment advice, nor should it be construed in any way as tax, accounting, legal or regulatory advice. To that end, investors should seek independent legal and financial advice, including advice as to tax consequences, before making any investment decision.
Charts and graphs provided herein are for illustrative purposes only. Past performance is no guarantee of future results. The indexes are unmanaged and do not include any expenses, fees or sales charges. It is not possible to invest directly in an index. Any index referred to herein is the intellectual property (including registered trademarks) of the applicable licensor. Any product based on an index is in no way sponsored, endorsed, sold or promoted by the applicable licensor and it shall not have any liability with respect thereto.