


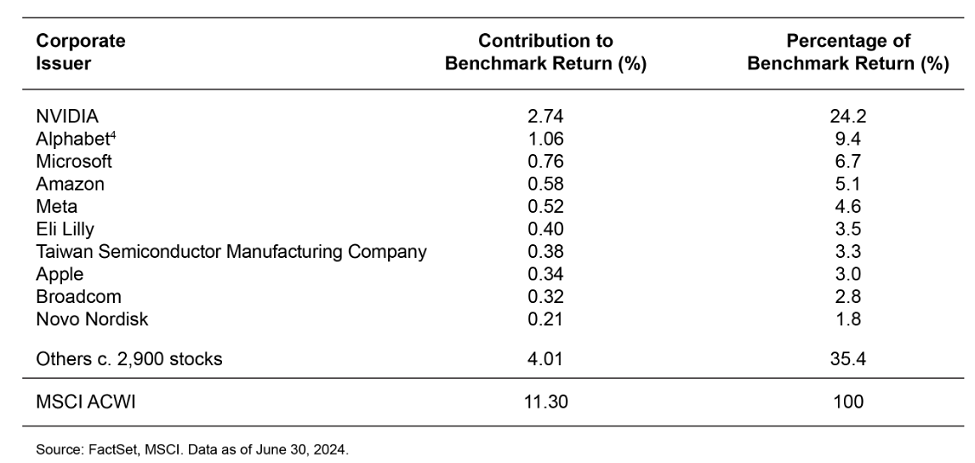
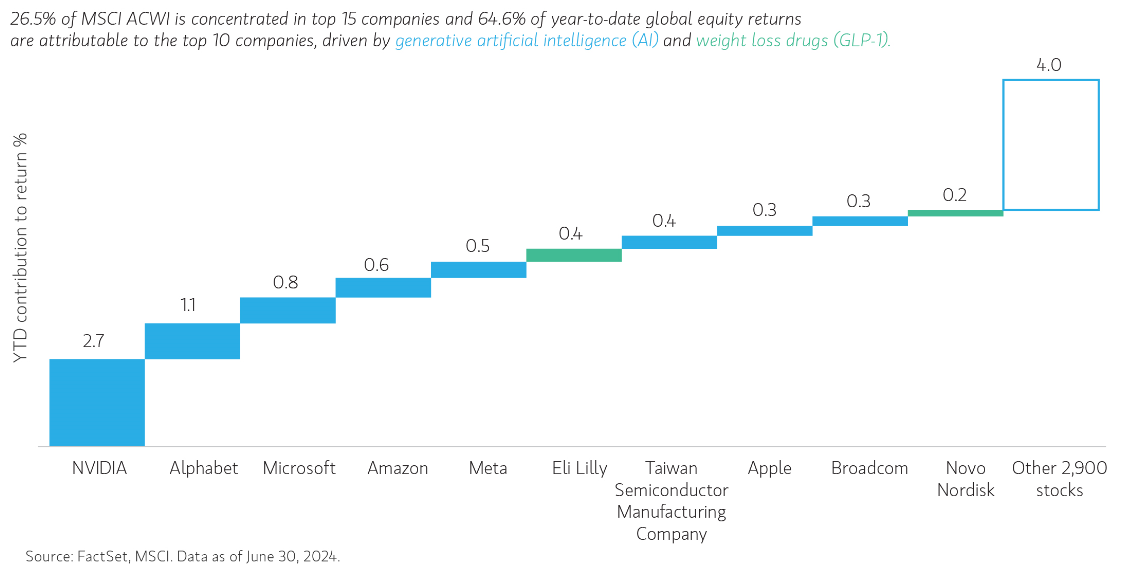
In 2022, we highlighted in our publication, "Opportunity Optimum,"1 how investors' flight to perceived safety amid post-pandemic market volatility had increased benchmark concentration. Two years later, that risk appears even more pronounced as the top 15 companies have increased from 20% to 26.5% of the MSCI ACWI Index since 2022.2 This increased benchmark concentration has been driven primarily by investor enthusiasm for megatrends of generative artificial intelligence (AI) and weight loss drugs (GLP-1).
Notably, 64.6% of MSCI ACWI's year-to-date returns are attributable to the top 10 contributors, led by the parabolic increase in NVIDIA's market capitalization, joining Apple and Microsoft as the world's $3 trillion dollar companies. Meanwhile, the other c. 2,900 stocks account for the remaining 35.4% of returns.3
For active managers of concentrated portfolios, this has been a difficult market to navigate, as benchmark performance is increasingly driven by a select few names. However, this concentration amplification effect may work similarly on the way down as on the way up. The same theme that adds trillions in market value may be first to lose a comparable amount!
Therefore, we continue to caution against reliance on passive exposure to indices globally. As bottom-up stock pickers, we believe it's essential to take a first principles approach to investing. We believe a better strategy may be to actively invest in opportunities outside the largest names, by focusing on fundamentally sound businesses with higher revenue and cash flow outlooks, diversified end markets and attractive valuations.
Top 10 Companies Contributing Outsized Returns to MSCI ACWI (% contribution YTD as of 6/30/2024)
Bottom line: While today's increased market concentration can be challenging for investors to navigate, it also creates opportunities for active managers to uncover strong companies outside the largest names.
1 https://www.morganstanley.com/im/publication/insights/articles/article_opportunityoptimum_us.pdf
2 Source: Factset, MSCI. Data as of June 30, 2024.
3 Source: Factset, MSCI. Data as of June 30, 2024.
4 Includes Alphabet Inc. Class A and Class C shares.
MSCI ACWI Index is an unmanaged free-float-adjusted market-capitalization-weighted index designed to measure the equity market performance of developed and emerging markets. Unless otherwise stated, index returns do not reflect the effect of any applicable sales charges, commissions, expenses, taxes or leverage, as applicable. It is not possible to invest directly in an index. Historical performance of the index illustrates market trends and does not represent the past or future performance of any strategy or investment product. For informational purposes and does not constitute an offer or a recommendation to buy or sell any particular security. MSCI indexes are net of foreign withholding taxes. Source: MSCI. MSCI data may not be reproduced or used for any other purpose. MSCI provides no warranties, has not prepared or approved this report, and has no liability hereunder.
Featured Insights


Risk Considerations: There is no assurance that a strategy will achieve its investment objective. Portfolios are subject to market risk, which is the possibility that the market values of securities owned by the portfolio will decline. Market values can change daily due to economic and other events (e.g. natural disasters, health crises, terrorism, conflicts and social unrest) that affect markets, countries, companies or governments. It is difficult to predict the timing, duration, and potential adverse effects (e.g. portfolio liquidity) of events. Accordingly, you can lose money investing in this strategy. Please be aware that this strategy may be subject to certain additional risks. In general, equity securities' values also fluctuate in response to activities specific to a company. Investments in foreign markets entail special risks such as currency, political, economic, and market risks. The risks of investing in emerging market countries are greater than the risks generally associated with investments in foreign developed countries. Illiquid securities may be more difficult to sell and value than publicly traded securities (liquidity risk). Investments in small- and medium- capitalization companies tend to be more volatile and less liquid than those of larger, more established, companies. Derivative instruments may disproportionately increase losses and have a significant impact on performance. They also may be subject to counterparty, liquidity, valuation, correlation and market risks. Privately placed and restricted securities may be subject to resale restrictions as well as a lack of publicly available information, which will increase their illiquidity and could adversely affect the ability to value and sell them (liquidity risk).
The views and opinions and/or analysis expressed are those of the author or the investment team as of the date of preparation of this material and are subject to change at any time without notice due to market or economic conditions and may not necessarily come to pass. Furthermore, the views will not be updated or otherwise revised to reflect information that subsequently becomes available or circumstances existing, or changes occurring, after the date of publication. The views expressed do not reflect the opinions of all investment personnel at Morgan Stanley Investment Management (MSIM) and its subsidiaries and affiliates (collectively “the Firm”), and may not be reflected in all the strategies and products that the Firm offers.
Forecasts and/or estimates provided herein are subject to change and may not actually come to pass. Information regarding expected market returns and market outlooks is based on the research, analysis and opinions of the authors or the investment team. These conclusions are speculative in nature, may not come to pass and are not intended to predict the future performance of any specific strategy or product the Firm offers. Future results may differ significantly depending on factors such as changes in securities or financial markets or general economic conditions.
This material has been prepared on the basis of publicly available information, internally developed data and other third-party sources believed to be reliable. However, no assurances are provided regarding the reliability of such information and the Firm has not sought to independently verify information taken from public and third-party sources.
This material is a general communication, which is not impartial and all information provided has been prepared solely for informational and educational purposes and does not constitute an offer or a recommendation to buy or sell any particular security or to adopt any specific investment strategy. The information herein has not been based on a consideration of any individual investor circumstances and is not investment advice, nor should it be construed in any way as tax, accounting, legal or regulatory advice. To that end, investors should seek independent legal and financial advice, including advice as to tax consequences, before making any investment decision.
Charts and graphs provided herein are for illustrative purposes only. Past performance is no guarantee of future results. The indexes are unmanaged and do not include any expenses, fees or sales charges. It is not possible to invest directly in an index. Any index referred to herein is the intellectual property (including registered trademarks) of the applicable licensor. Any product based on an index is in no way sponsored, endorsed, sold or promoted by the applicable licensor and it shall not have any liability with respect thereto.