


As March is Women's History Month, it's timely that we review women's headway moving up the corporate ranks and the progress of gender diversity initiatives worldwide.
KEY POINTS
1. Globally, female representation at the board and employee levels is much higher than at the executive and senior management levels.
2. The trickle-down effect from increased gender representation in the boardroom, expected to help resolve the diversity pipeline issue, has not taken place as quickly as anticipated.
3. This may be due in part to national quotas driving the high percentage of female board directors, particularly in countries or markets that lag their peers, where inclusive workplace cultures are not yet widely in place.
Despite large strides made in placing more women in the corporate boardroom, women continue to face major challenges and disparities at various career stages. In both U.S. and international large-cap markets, there is higher female representation at the board and employee level than that at the executive and senior management level.
Globally, Female Representation Lags at Corporate Senior Levels
(%) Female Representation at Board, Executive, Senior Management and Employee Levels
(S&P 500 Index and MSCI World ex US Index, December 2023)
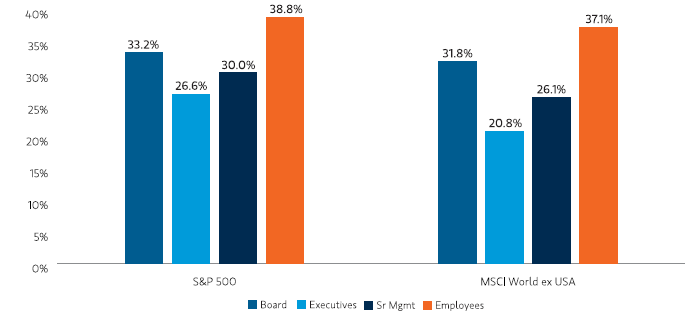
Source: Factset and Equileap.
Compared to their international peers, however, U.S. large-cap companies have a higher level of gender diversity across all job levels, particularly among executives and senior managers. Within the S&P 500, 26.6% of executives are female compared to 20.8% for the MSCI World ex USA, while women in senior management positions stands at 30% versus 26.1%, respectively.
The push toward parity
Over the past decade, many regulatory bodies have set minimum quotas for board gender diversity, either mandatory or voluntary. These quotas, primarily targeting publicly listed companies, are mostly introduced by legislation, central governments or primary stock exchanges. With quotas in place, we see more women joining corporate boards globally, with notable variations in countries.
As board members usually play an active role in hiring decisions and influencing the culture of their companies, the widespread expectation has been that a greater number of female board directors would lead to an increase in the number of female executives and managers. This implicit assumption is commonly referred to as the trickle-down effect.
Yet, the data indicate the trickle-down effect has not noticeably closed the gender diversity gap, and the pipeline issue still hampers the career advancement of women and others. A possible explanation for this situation is that high board gender diversity has been driven mostly by the impact of national quotas or quota-equivalent policies.
Countries and quotas
To delve into this issue, our research reviewed the regulations on board gender diversity for all countries or markets in the MSCI All Country World Index. The results were complex. On the one hand, there is a remarkable difference between groups: countries with mandatory quotas of over 10% or voluntary quotas for board gender diversity tend to have a higher percentage of female representation. Conversely, countries with a mandatory quota of at least one woman — or no quota at all — tend to see much lower female board representation. However, some countries near or at board gender parity, such as New Zealand, do not necessarily have a quota in place. In those instances, the higher percentage of female directors could be a natural result of stronger social norms on gender equality.
Bottom line: As the gender diversity gap at the critical management and senior levels are not closing as quickly as expected, we believe investors and companies need to intensify their efforts to address this situation. We think companies that can close their diversity gaps sooner are more likely to benefit from a boost in their intellectual and human capital.
To read the full research report, "Parity Beyond the Boardroom: Closing Diversity Gaps in the Corporate Pipeline,"click here
Definitions:
Executives are as defined by the company or represent those individuals that form the company's Executive Committee/Board or Management Committee/Board or the equivalent.
Senior management is defined and reported by the company, and usually represents managerial levels below the executive level.
Index Definitions:
S&P 500® Index measures the performance of the large-cap segment of the U.S. equities market, covering approximately 75% of the U.S. equities market. The index includes 500 leading companies in leading industries of the U.S. economy.
MSCI World ex-US Index measures the equity market performance of large and mid-cap stocks across 22 of 23 developed markets (DM) countries, excluding the United States. The index covers approximately 85% of the free float-adjusted market capitalization in each country. The term "free float" represents the portion of shares outstanding that are deemed to be available for purchase in the public equity markets by investors. The performance of the Index is listed in U.S. dollars and assumes reinvestment of net dividends.
The views and opinions and/or analysis expressed are those of the author or the investment team as of the date of preparation of this material and are subject to change at any time without notice due to market or economic conditions and may not necessarily come to pass. Furthermore, the views will not be updated or otherwise revised to reflect information that subsequently becomes available or circumstances existing, or changes occurring, after the date of publication. The views expressed do not reflect the opinions of all investment personnel at Morgan Stanley Investment Management (MSIM) and its subsidiaries and affiliates (collectively “the Firm”), and may not be reflected in all the strategies and products that the Firm offers.
Forecasts and/or estimates provided herein are subject to change and may not actually come to pass. Information regarding expected market returns and market outlooks is based on the research, analysis and opinions of the authors or the investment team. These conclusions are speculative in nature, may not come to pass and are not intended to predict the future performance of any specific strategy or product the Firm offers. Future results may differ significantly depending on factors such as changes in securities or financial markets or general economic conditions.
This material has been prepared on the basis of publicly available information, internally developed data and other third-party sources believed to be reliable. However, no assurances are provided regarding the reliability of such information and the Firm has not sought to independently verify information taken from public and third-party sources.
This material is a general communication, which is not impartial and all information provided has been prepared solely for informational and educational purposes and does not constitute an offer or a recommendation to buy or sell any particular security or to adopt any specific investment strategy. The information herein has not been based on a consideration of any individual investor circumstances and is not investment advice, nor should it be construed in any way as tax, accounting, legal or regulatory advice. To that end, investors should seek independent legal and financial advice, including advice as to tax consequences, before making any investment decision.
Charts and graphs provided herein are for illustrative purposes only. Past performance is no guarantee of future results. The indexes are unmanaged and do not include any expenses, fees or sales charges. It is not possible to invest directly in an index. Any index referred to herein is the intellectual property (including registered trademarks) of the applicable licensor. Any product based on an index is in no way sponsored, endorsed, sold or promoted by the applicable licensor and it shall not have any liability with respect thereto.