Scroll Up Top
Download icon
Download

January proved to be a decent month for fixed income assets. President Trump's first days in office introduced a layer of uncertainty to the global market; however, as this was a known event, significant market movements remained minimal. Economic data continues to play a crucial role and the divergence in economic conditions and central bank policies has become increasingly apparent, with the U.S. economy appearing to maintain a strong leader across the globe.

Developed market government bond yields displayed mixed performance over the month. The yield on the 10-year U.S. Treasury fell by 3 basis points, with more pronounced declines observed in Canada and especially in the UK. Conversely, yields rose in Japan, Germany, Australia, and New Zealand. Emerging market yields generally trended lower throughout the month. Yields in Mexico and Brazil fell 34bp and 36bp, respectively.

The dollar showed little variation during the month, while the Japanese yen and Norwegian krone emerged as the strongest performers in the developed market space. In contrast, the British pound and Canadian dollar experienced the most depreciation. Overall, EM currencies exhibited a generally stronger performance.

In the corporate sectors, Euro-denominated investment grade corporates outperformed their U.S. counterparts, while U.S. high yield corporates surpassed Euro high yield. Spreads in both corporate sectors tightened over the month. In the securitized markets, credit spreads continued to tighten, while agency mortgage-backed spreads remained largely unchanged.

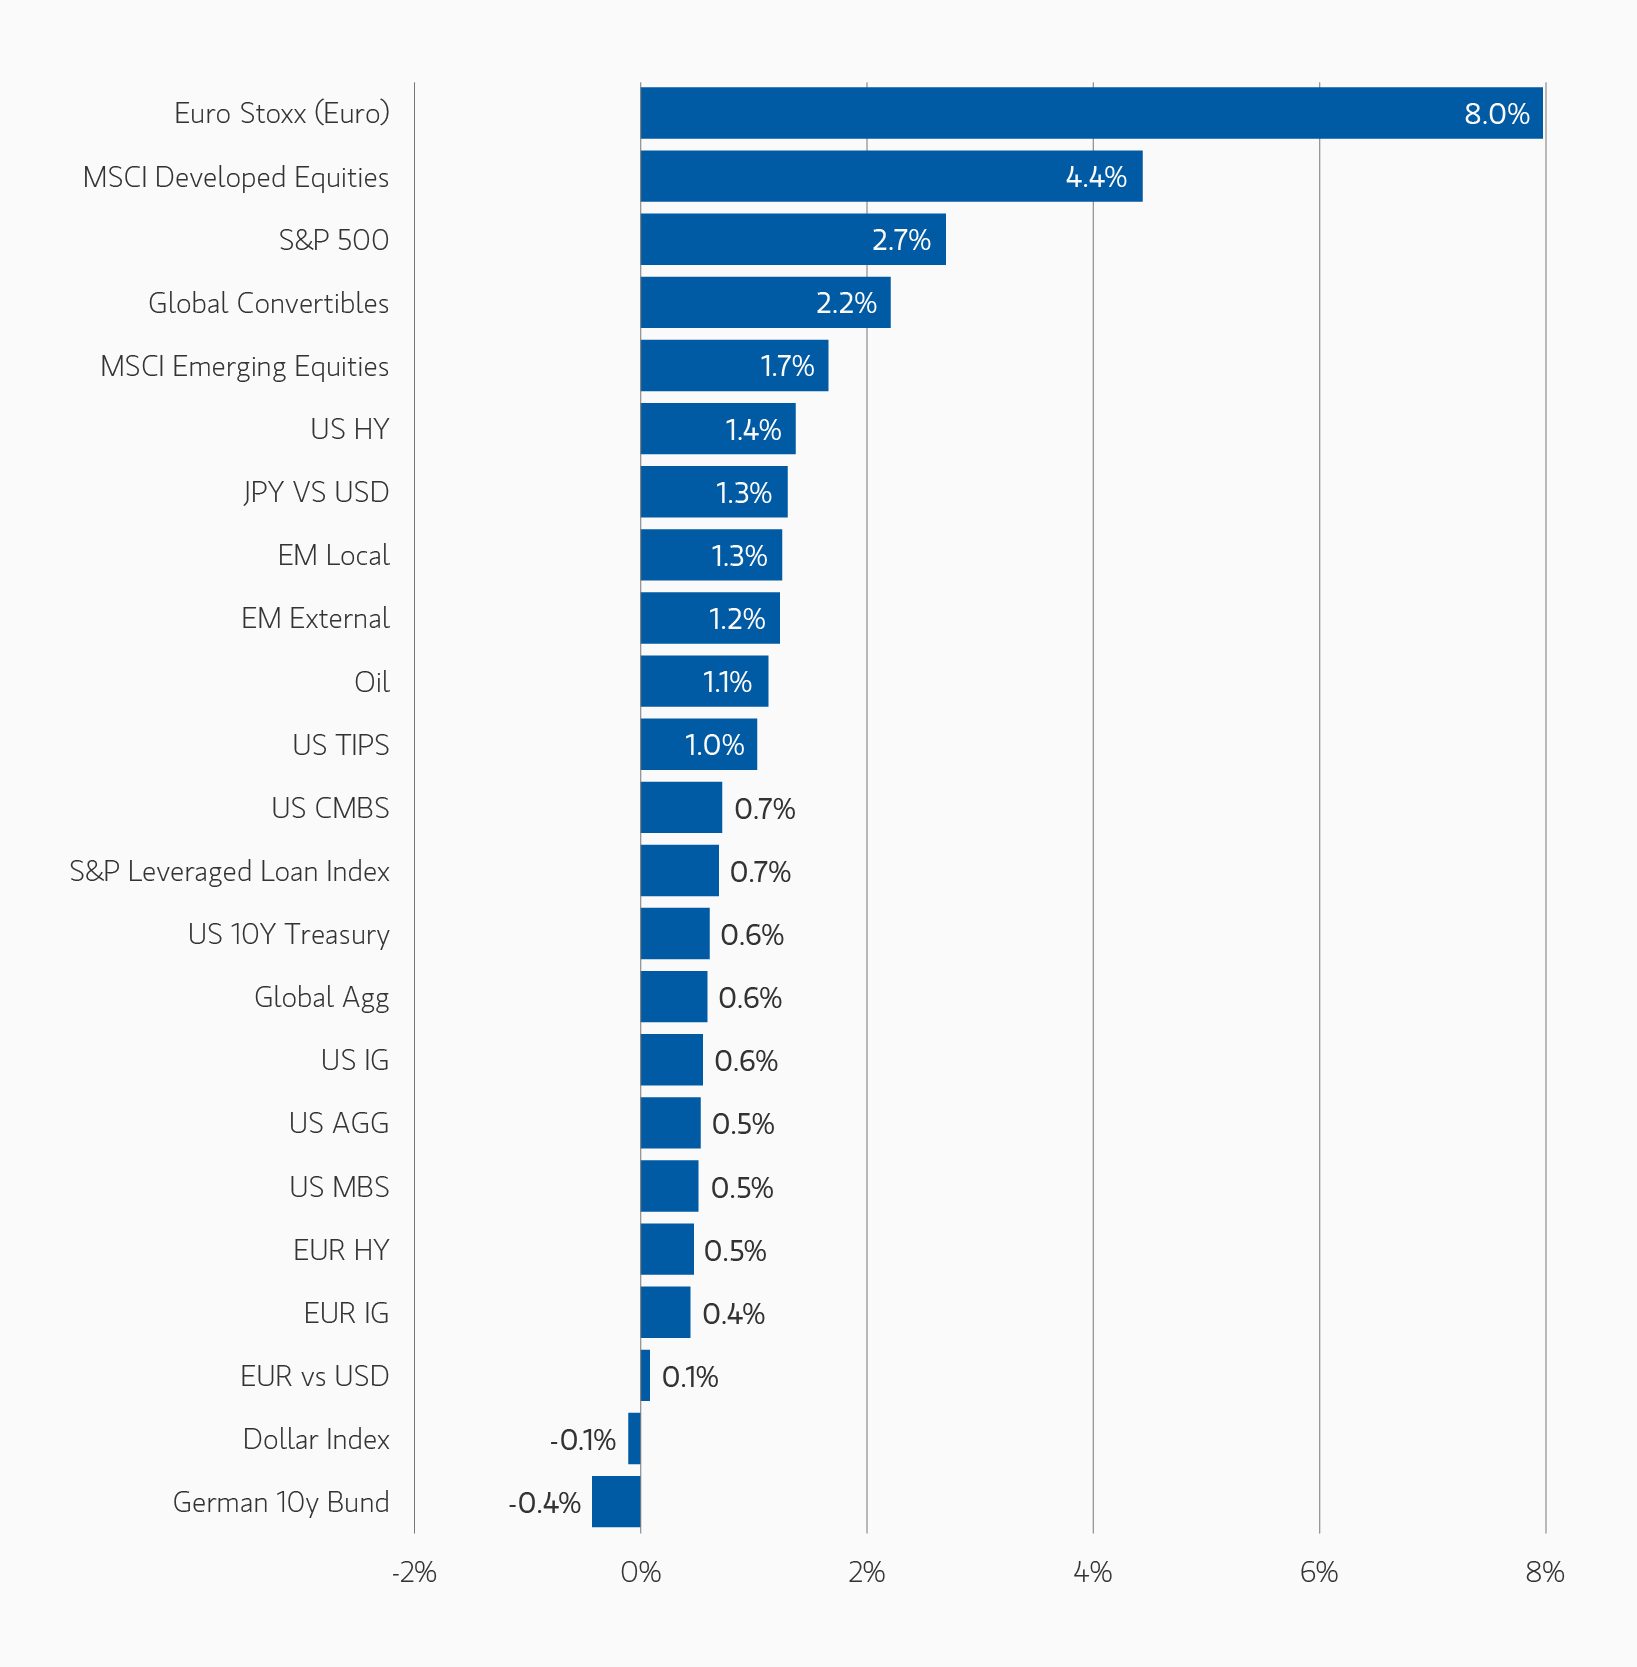
Asset Performance Year-to-Date

DISPLAY 1
insight_anonagainoffagainworld_display-1.png

Note: USD-based performance. Source: Bloomberg. Data as of January 31, 2025. The indexes are provided for illustrative purposes only and are not meant to depict the performance of a specific investment. Past performance is no guarantee of future results. See below for Index definitions.

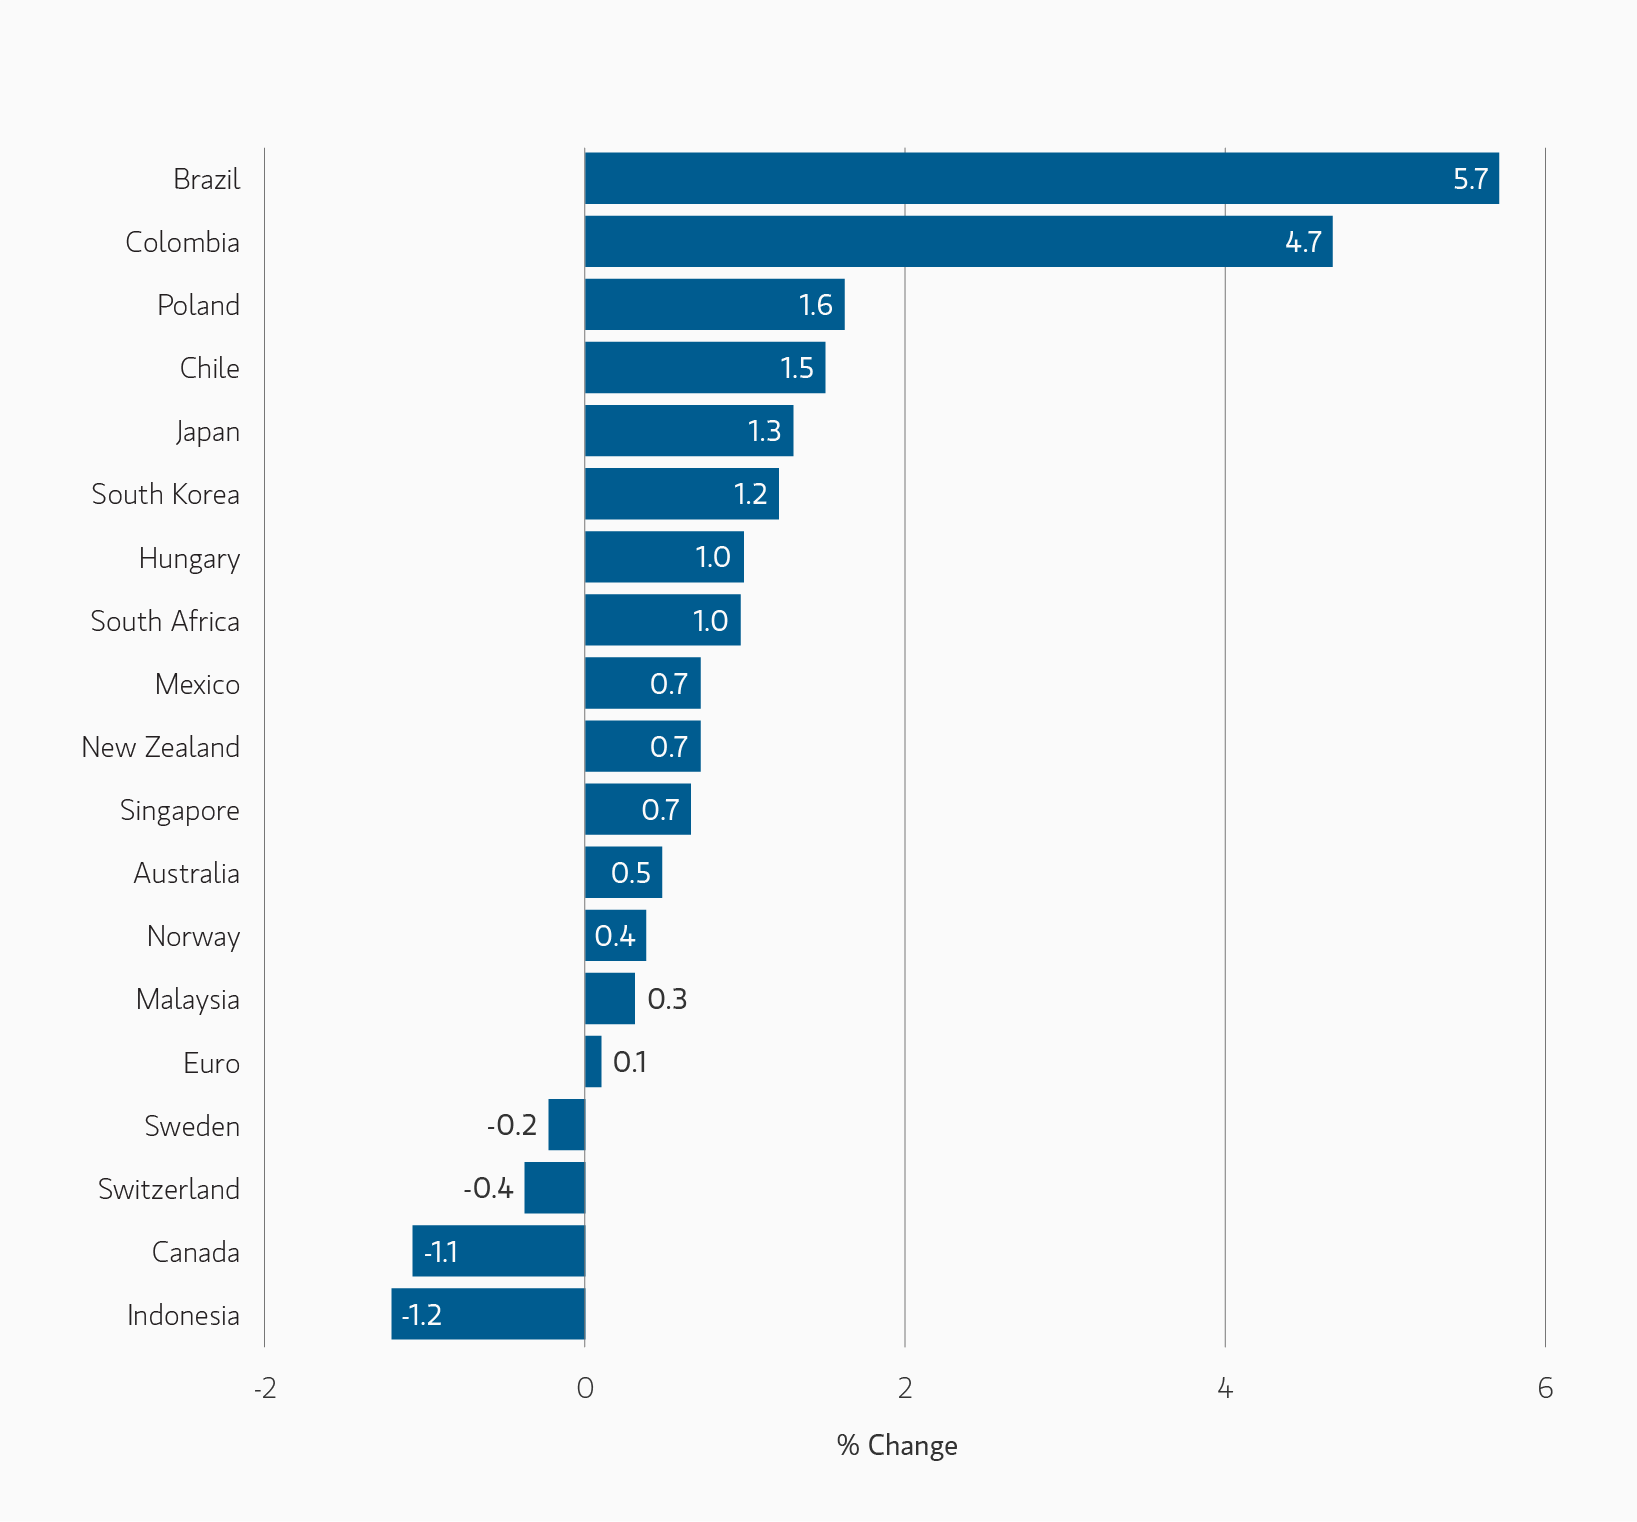
Currency Monthly Changes vs. USD (+ = appreciation)

DISPLAY 2
insight_anonagainoffagainworld_display-2.png

Note: Positive change means appreciation of the currency against the USD. Source: Bloomberg. Data as January 31, 2025.

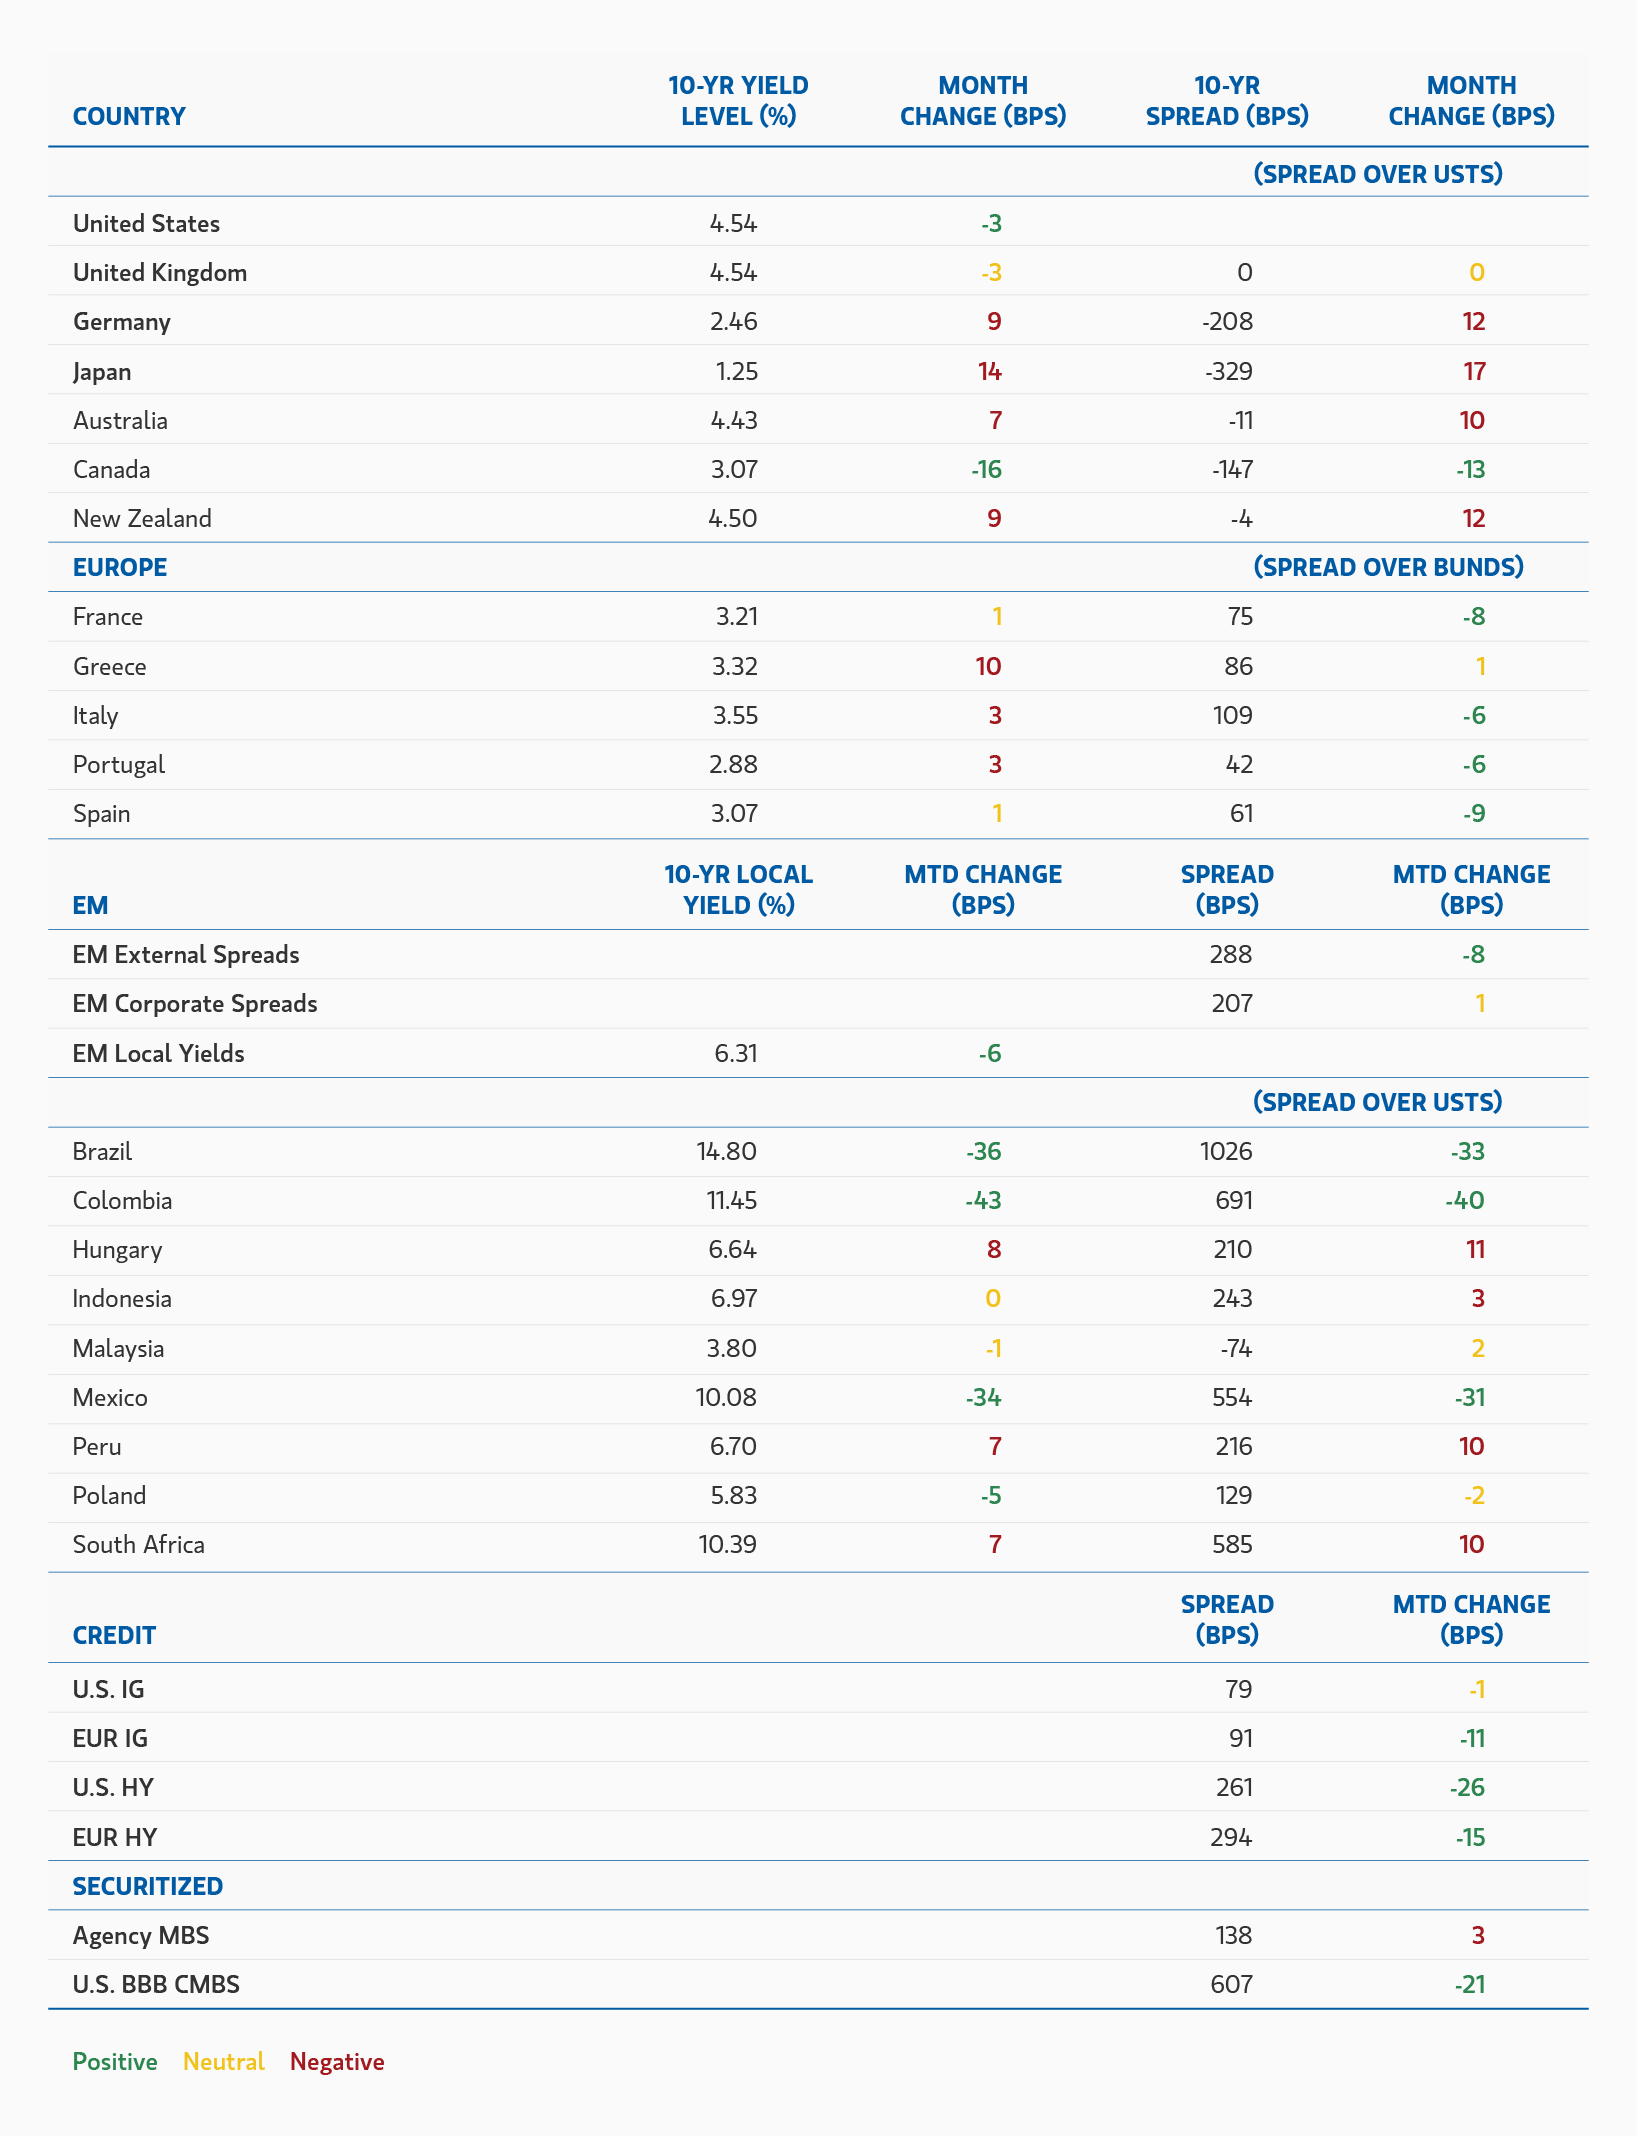
Major Monthly Changes in 10-Year Yields and Spreads

DISPLAY 3
insight_anonagainoffagainworld_display-3.png

Source: Bloomberg, JPMorgan. Data as of January 31, 2025.

Fixed Income Outlook
Markets are now faced with the challenge of becoming proficient at reading/understanding President Trump’s modus operandi and ultimate goals, as policy directives so far have been issued — and rescinded or postponed — at a rapid pace. In the first few days in office, the administration signaled its intent to execute as many campaign promises as possible, with a flurry of executive orders. Markets were initially pleased that the early efforts focused on immigration and government efficiency while steering clear of tariffs. Unfortunately, that reprieve did not last long. On the last day of January, President Trump announced an immediate 25% blanket tariff on all Mexican and Canadian goods, with a 10% carve out for Canadian energy, and an additional 10% tariff on China. Although campaign rhetoric pointed to an aggressive stance on tariffs, the markets were nonetheless caught off guard by the announcement, unsettled by the magnitude of the levies and timing of their targeted effective date. Fortunately, but perhaps unsurprisingly, Mexico and Canada were able to defuse the immediate risk and negotiate with the U.S. administration to postpone implementation for one month. Although China’s tariff increase remains on the table, that in itself is not surprising or overly worrisome given the U.S. government’s desire to “delink” from China.

While financial markets had a good January, overcoming angst about the incoming U.S. presidential administration, the future remains quite murky. The complication is that the U.S. economy has, in effect, “landed” — meaning that for all the talk of entrenched inflation and incipient recession risk, the economy’s performance was remarkably stable. It is possible that growth has reached a new higher equilibrium, call it 2.5% real growth and 2.5% inflation with a stable, full employment labour market. And Federal Reserve (Fed) policy may have, by skill and/or luck, arrived at the appropriate policy rate to maintain that stability. So, if all looks good for the U.S. economy (with or without further rate cuts), the president’s ardent desire to disrupt trade policy and potentially trigger a change in Fed policy is not good for asset prices, which by most calculations are highly or fully valued for both credit and equities. Outside the U.S., the 10-year government bond yields in most countries look okay given economic and policy trajectories. There is an old adage that business cycles don’t die of old age, they are “murdered”, typically by shocks from policy mistakes, exogenous events or bubbles. In this case, market pricing on a whole host of assets is dependent on the absence of policy errors. With the Trump administration’s seemingly relentless focus on immigration and trade, the risk of policy upsetting the current equilibrium has been growing. That said, U.S. Treasury 10-year yields are likely to remain range-bound with the caveats noted.

The central question is whether the Trump administration can implement its policies without causing a pullback in asset prices. Initially, the market’s reaction to Trump’s victory was positive; the thinking was that although trade and immigration policies were not positives for growth and low inflation, they would be offset by other positives in the policy basket (deregulation, tax cuts) that would, on balance, benefit the economy. This assumption is now being challenged as the administration is implementing the economically negative components of the policy basket first, with the pro-growth elements taking longer to be implemented and their impact therefore delayed. In addition, given a narrow Republican majority in Congress it is difficult to be too confident about how much of the pro-growth agenda will be passed. And, specifically regarding trade policy, we still do not know the ultimate objective(s). The administration has laid out three goals: (1) establish a negotiating tool to achieve other goals, like drug interdiction and illegal immigration; (2) raise money, to either pay for other tax cuts or spend elsewhere; and (3) reduce trade dependency to transition to a more autarkic economy. It is not yet clear which one of these is most important to the administration; this uncertainty will make investing challenging in the months ahead as the “true colours” of the administration’s aims come to light.

What does this mean for monetary policy? Tariff uncertainty means less certain U.S. monetary policy. Tariffs — and potentially large ones as directed by the Trump administration — should be viewed as a consumer tax (like the value-added tax, VAT, used in much of the world) and a negative supply shock. This would be a growth-reducing, inflation-enhancing shock to the U.S. economy, while the added uncertainty alone could keep inflation higher than otherwise. This scenario is likely to make the Fed cautious about further rate cuts. While we have been skeptical that the Fed would deliver two rate cuts in 2025, it had remained a distinct possibility. Now, two cuts look even less likely and, assuming tariffs are eventually implemented (we think a 10% levy across the board does not look out of line with administration rhetoric or goals), the impact could cause the Fed to stop cutting rates entirely. Notably, the opposite is true for most other countries. As we saw with Canada, the market immediately priced in additional aggressive rate cuts to offset the deflationary impact of tariffs on the Canadian economy. This relative response rate would, on the surface, suggest a preference for non-U.S. government bonds (except for Japan, whose central bank is raising rates no matter what). But, the increasing headwinds for the world economy and a likely stronger dollar usually means falling prices for risky assets and, importantly, lower U.S. Treasury yields. Netting these forces out leaves us with a small underweight to U.S. interest rate risk relative to the rest of the world. Given all the uncertainty with economic and policy outcomes, we think running a conservative interest rate strategy makes the most sense for now.

Credit markets wobbled a bit on the tariff news but quickly regained their equilibrium, attesting to the still-strong fundamentals underlying credit. With the future murkier and valuations high, we think it is prudent to be prudent. It continues to be true — maybe even more so given uncertainty surrounding the Trump administration — that it will be difficult for spreads to tighten much from current levels. However, we believe that does not detract from the overall total return possibilities of these bonds. With fundamentals still strong, a seemingly voracious investor appetite for taking down supply, and central banks still in easing mode, it is difficult to be underweight. This backdrop requires being highly selective and actively managing rating, country and industry holdings to avoid the inevitable problems likely to arise in the next 12 months. We remain focused on avoiding companies and industries at risk (either from idiosyncratic underperformance, secular challenges or from increased management aggressiveness) while building as much yield as is reasonable into the portfolio without jeopardizing returns from credit losses or spread widening. We still identify better opportunities in U.S. names and European banks in euro-denominated bonds, although we have been selectively reducing overweight positions on outperformance.

Securitized credit remains our go-to overweight sector. But even here, the recent streak of strong performance is reducing its relative and absolute performance. While many components of this sector (commercial mortgage-backed securities, residential mortgage-backed securities, asset-backed securities) look attractive on an equal ratings comparison to credit, absolute spreads, like in credit, are — relative to their own history — nearing levels where it is less attractive to be long. That said, we believe the technical dynamics and fundamentals remain compelling. New issues are frequently multiple times oversubscribed, making it difficult to accumulate large positions. Amid the current noise and uncertainty in the world, we believe this sector can continue to perform well. In the agency sector, higher coupon securities continue to be attractive compared to investment grade corporates and other agency coupon structures, and we believe they are likely to outperform U.S. Treasury securities. Selectivity remains key.

Emerging market (EM) bonds have performed well in early February as the trade war with Mexico was (temporarily) defused. How long this can last is an open question. It is still very possible that postponed tariffs could eventually come into effect. As such, we do not expect the current lull in negativity or the recently good price performance to continue unabated. Nevertheless, we believe that countries with solid economic outlooks, decent growth, falling inflation, high real yields and central banks willing and able to cut interest rates — despite policy changes in the U.S. — are likely to perform well. Country and security selection remain critical. We are keeping an eye on Brazilian local bonds as the fiscal and monetary outlook evolves in 2025. We also think some of the higher-yielding countries with weaker trade linkages to the U.S., like Egypt, are likely to continue to perform relatively better.

In currency markets, the U.S. dollar is likely to remain firm in the months ahead despite its recent correction after the Mexico and Canada tariff postponement. Dollar weakness is likely to be transitory. While the dollar’s valuation is high, its fundamental support remains robust, and most other currencies around the world look significantly more challenged. A potentially aggressive U.S. tariff policy would exacerbate the dollar’s strength, especially if other countries let their currencies depreciate to offset higher tariffs. However, caveats to this optimistic narrative could be a deterioration in the U.S. labour market, a general weakening in growth, or diminishing confidence in U.S. budget policy. The U.S. economy thrives on capital flows, the mirror image of the trade deficit. If non-U.S. investors lose confidence in the U.S., financing the investment surge alongside the quite outsized public sector deficits may become problematic. These events might pressure the Fed to become more aggressive in cutting interest rates given its dual mandate. The more likely cause of the dollar falling would be something going wrong on the U.S. side of the equation. But, with tariffs imminent, this is difficult to see. We believe avoiding underweight U.S. dollar positions versus other developed market currencies makes sense. That said, we also believe more idiosyncratic positions in selective EM currencies do have merit — selectivity being the key word.

Developed Market Rate/Foreign Currency

Monthly Review:
Developed market (DM) government bond yields initially rose in January, continuing December’s sell-off, before a slightly weaker than expected US CPI print and undemanding central bank expectations helped markets rally back to end the month close to unchanged. Yield curves continued to steepen in Europe while remaining largely unchanged in the US. At the January FOMC meeting, the Fed held interest rates steady, as expected, and Chair Powell said there would be no rush to cut them again. US economic data remained positive, with 256,000 new jobs created in December, and inflation continuing on a downward path, particularly the services and shelter components. But with growth resilient, the market expects the next Fed cut to only be in June.

Across the Atlantic, the European Central Bank cut interest rates as expected and kept more easing on the table, sticking to its view that inflation is increasingly under control despite concerns about global trade. Economic data was slightly better than expected but still consistent with only modest growth. The PMI surveys continued to suggest the manufacturing sector, especially in Germany and France, are in recessionary territory, but this is off-set by robust growth in services, supported by strong household income growth. The ECB is priced to cut interest rates a further 85bp in 2025, as current policy rates are thought to be restrictive, the risks to growth are increasingly skewed to the downside and it is hoped that inflation will continue to decline towards target. Gilts followed the global trend of higher interest rates in the first half of the month, but managed to outperform USTs modestly in the second half of the month as December inflation data were weaker than expected and growth data in general surprised to the downside.  

In foreign exchange markets, the US dollar mirrored moves in interest rate differentials - strengthening early in the month before weakening as US yields fell. Stronger US growth and equity market performance have supported the dollar, but the lack of day-one tariffs under the Trump administration also prompted a weakening, particularly against key trading partners. The yen benefited from lower yields and more hawkish communication by the Bank of Japan, while Sterling and the Canadian dollar lagged.

Outlook:
We are neutral on duration in DM markets overall, aside from Japan, and retain curve steepening exposures, particularly in the U.S. We remain underweight the U.S. vs the U.K. and New Zealand, where we think central banks are likely to cut rates more than is currently priced. We also remain underweight JGBs, and long Japanese inflation breakevens. With inflation in Japan appearing to move structurally higher, and the BoJ signalling it believes there is a higher likelihood of the economy attaining positive wage-price dynamics, we see a more extended hiking cycle than the market currently prices in. We continue to favour the Australian dollar and U.S. dollar versus the Canadian dollar, and also maintain a positive view on the yen over the euro.

Emerging Market Rate/Foreign Currency

Monthly Review:
Emerging Markets debt had strong performance to start off the year across the major segments of the asset class. EM currencies rallied aided by the US dollar weakening for most of the month. Sovereign credit spreads compressed while corporate spreads were flat, but both segments of the asset class benefitted from the fall in US Treasury rates. The US Fed met for its first meeting of the year and held rates, which was largely expected. President Trump started his presidency with a slew of executive orders which added some volatility to the market - foreign policy and the future of tariff still remain in question. Colombia was momentarily caught in tariff crossfires as a result of US deportation measures, but tariffs were subsequently dropped after policy discussions. Brazil’s central bank hiked rates as inflation remains stubborn and fiscal spending continues. Investors remain hesitant to invest in emerging markets debt as shown by both local currency and hard currency funds seeing outflows during the first month of the year.

Outlook:
Emerging Markets debt started the year off strong aided by a weakening US dollar and a fall in US Treasury rates. While US politics are often not directly related to emerging markets, policies can have spillover effects. Our investment process remains focused on individual country level fundamentals so while foreign policy and trade policy are still in question, we will monitor this impact at the country level. As the US Fed’s tone has turned less dovish, we may see more selective rate cuts from EM central banks but real yield differentials between EM and DM remain attractive. Additionally, continued US dollar weakness would be a positive tailwind for EM currencies. Country selection and finding investment opportunities that are more shielded from US policy will be key to drive performance in emerging markets debt.

Corporate Credit

Monthly Review:
European investment grade spreads tightened in January, supported by a strong technical. Demand for risk was generally strong with most primary deals seeing large order books and limited new issue concessions. Benign tariff news flow further supported risk markets – the market reacted sharply to a WSJ article suggesting that there would be no immediate tariff actions for the Trump presidency. However, tariffs announced on the last day of the month impacting Mexico, Canada & China will likely concern markets. In the corporate space, companies began reporting Q4 earnings. Early takeaways suggest we’re going to see another uneventful but very strong quarter for banks, with no major deterioration in asset quality or net income generation. Interestingly, profit expectations improved slightly for export-oriented-sectors, including manufacturing and financial services. On the M&A front, activity in the Italian banking space continued with Monte dei Paschi launching a €13.3bn takeover offer for its larger domestic rival Mediobanca, an offer quickly rejected by Mediobanca. The market continues to look out for structural trends as more companies report.

Performance in the U.S. and global high yield markets was strong in January amid generally strong demand, a primary market calendar that was slow to gain momentum and a modest retreat in 5-year U.S. Treasury and German Bund yields in the second half of the month. With a dearth of issuance and ample demand over the first three weeks of the year, lower-quality beta led performance. The dynamic shifted later in the month as a surge in acquisition-related financings reignited the primary market, and valuations in lower-rated structures within the cable & satellite TV sector came under modest pressure. The Fed’s decision in January to maintain their key policy rate and the European Central Bank’s decision to reduce their key policy rate by a quarter-point were well telegraphed elicited little reaction. The month ended with the market squarely focused on the potential for impending trade tariffs.

Global convertible bonds generated strong returns relative to equities and significantly in excess of other fixed income asset classes in January.    Returns were led by solid performances in the US and Asia following a selloff in December.  Issuance was disappointing at $3.2B (half of historic average) following a very strong December and partly due to uncertainty post President Trump’s inauguration.   The Fed’s decision in January to maintain their key policy rate and the European Central Bank’s decision to reduce their key policy rate by a quarter-point were well telegraphed and elicited little reaction. The convertible bond market also performed relatively well post the DeepSeek driven technology selloff.  The month came to a close with the market squarely focused on threatened shifts in trade policy.

Outlook:
Looking forward our base case remains constructive for credit supported by expectations of a “soft landing”, fiscal policy that remains supportive of growth/employment/ consumption and strong corporate fundamentals, supported by corporate strategy that is low risk. Manageable net issuance coupled with strong demand for the “all-in” yield offered by IG credit is expected to create a supportive technical dynamic. When looking at credit spreads, we view the market as offering some value but see carry as the main driver of return, with additional gains coming from sector and, increasingly, security selection. Given the uncertain medium term fundamental backdrop, we have less confidence in material spread tightening.

We are progressing through the first quarter of 2025 with a relatively balanced view for the high yield market. This outlook includes the expectation for episodic volatility, and the sober realization that, while yields remain historically attractive, on a spread-basis the high yield market is priced nearly to perfection. We come to this conclusion after a thorough analysis of factors including the evolving monetary policy of global central banks, U.S. and global economic growth, consumer health, the fundamentals of high yield issuers, technical conditions, and valuations. Ultimately, we believe that, on average, the yield provides attractive compensation for the underlying credit risk, but reaching for risk in lower-rated credits will be punitively rewarded.

We remain constructive on the global convertible bond market as we begin February. Technicals are strong, as convertible bonds have maintained a balanced profile, interest rates remain relatively high, equity valuations increased in 2024, and corporations continue to have financing needs. New convertible bond issuance was strong in 2024 and we expect that to continue as global central banks continue to modestly cut interest rates and bonds issued during the Covid-19 pandemic mature. Finally, we expect higher volatility this year as geopolitical tensions and regional tensions remain present and markets digest the policies of the Trump administration.

Securitized Products

Monthly Review:
In January, U.S. agency MBS spreads widened by 3bp and are now at +138bp compared to U.S. Treasuries. Given the significant tightening in other credit sectors, agency MBS continues to be one of the few areas in fixed income with attractive valuations. The Fed’s MBS holdings shrank by $27.5 billion in January to $2.210 trillion and are now down $486.5 billion from its peak in 2022. After a small dip in holdings in December, US Banks continued their trend of gradual increases, US banks’ MBS holdings rose by $6 billion to $2.649 trillion in January; bank MBS holdings are still down $323 billion since early 2022. Even with heavy supply levels, securitized credit spreads tightened materially in January. However, US IG Corporate spreads and US Agency MBS spreads were unchanged to slightly wider. After a slow December, securitized issuance was heavy in January due largely to the muted volumes during the holiday season waiting for the new  year; this supply was well absorbed and met with very strong demand.

Outlook:
We expect US agency MBS spreads to tighten as we expect flows from relative value investors and banks to increase due to the attractive return profile of this sector. We expect credit securitized spreads to be at or near their tights as they are currently trading near agency MBS spreads. Securitized credit sectors were among the best performing sectors in both 2024, and in the first month of 2025, and we expect this to continue for the remainder of 2025. We believe that returns will result primarily from cashflow carry in the coming months as we enter February with higher yields, but also get an added boost from potentially lower rates.  We still believe that current rate levels remain stressful for many borrowers and will continue to erode household balance sheets, causing stress for some consumer ABS, particularly involving lower income borrowers.  Commercial real estate also remains challenged by current financing rates. Residential mortgage credit opportunities remain our favorite sector currently and is the one sector where we remain comfortable going down the credit spectrum, as we remain more cautious regarding lower rated ABS and CMBS.   We remain positive on Agency MBS valuations as they continue to remain attractive versus investment-grade corporate spreads and versus historical agency MBS spreads. 

RISK CONSIDERATIONS

Diversification neither assures a profit nor guarantees against loss in a declining market.

There is no assurance that a portfolio will achieve its investment objective. Portfolios are subject to market risk, which is the possibility that the market values of securities owned by the portfolio will decline and that the value of portfolio shares may therefore be less than what you paid for them. Market values can change daily due to economic and other events (e.g., natural disasters, health crises, terrorism, conflicts, and social unrest) that affect markets, countries, companies, or governments. It is difficult to predict the timing, duration, and potential adverse effects (e.g., portfolio liquidity) of events. Accordingly, you can lose money investing in a portfolio. Fixed-income securities are subject to the ability of an issuer to make timely principal and interest payments (credit risk), changes in interest rates (interest rate risk), the creditworthiness of the issuer and general market liquidity (market risk). In a rising interest-rate environment, bond prices may fall and may result in periods of volatility and increased portfolio redemptions. In a declining interest-rate environment, the portfolio may generate less income. Longer-term securities may be more sensitive to interest rate changes. Certain U.S. government securities purchased by the strategy, such as those issued by Fannie Mae and Freddie Mac, are not backed by the full faith and credit of the U.S. It is possible that these issuers will not have the funds to meet their payment obligations in the future. Public bank loans are subject to liquidity risk and the credit risks of lower-rated securities. High-yield securities (junk bonds) are lower-rated securities that may have a higher degree of credit and liquidity risk. Sovereign debt securities are subject to default risk. Mortgage- and asset-backed securities are sensitive to early prepayment risk and a higher risk of default and may be hard to value and difficult to sell (liquidity risk). They are also subject to credit, market, and interest rate risks. The currency market is highly volatile. Prices in these markets are influenced by, among other things, changing supply and demand for a particular currency; trade; fiscal, money and domestic or foreign exchange control programs and policies; and changes in domestic and foreign interest rates. Investments in foreign markets entail special risks such as currency, political, economic and market risks. The risks of investing in emerging market countries are greater than the risks generally associated with foreign investments. Derivative instruments may disproportionately increase losses and have a significant impact on performance. They also may be subject to counterparty, liquidity, valuation, and correlation and market risks. Restricted and illiquid securities may be more difficult to sell and value than publicly traded securities (liquidity risk). Due to the possibility that prepayments will alter the cash flows on collateralized mortgage obligations (CMOs), it is not possible to determine in advance their final maturity date or average life. In addition, if the collateral securing the CMOs or any third-party guarantees are insufficient to make payments, the portfolio could sustain a loss.

DEFINITIONS

Basis point (bp): One basis point = 0.01%.

INDEX DEFINITIONS

The indexes shown in this report are not meant to depict the performance of any specific investment, and the indexes shown do not include any expenses, fees, or sales charges, which would lower performance. The indexes shown are unmanaged and should not be considered an investment. It is not possible to invest directly in an index.

“Bloomberg®” and the Bloomberg Index/Indices used are service marks of Bloomberg Finance L.P. and its affiliates and have been licensed for use for certain purposes by Morgan Stanley Investment Management (MSIM). Bloomberg is not affiliated with MSIM, does not approve, endorse, review, or recommend any product, and. does not guarantee the timeliness, accurateness, or completeness of any data or information relating to any product.

The Bloomberg Euro Aggregate Corporate Index (Bloomberg Euro IG Corporate) is an index designed to reflect the performance of the euro-denominated investment-grade corporate bond market.

The Bloomberg Global Aggregate Corporate Index is the corporate component of the Bloomberg Global Aggregate index, which provides a broad-based measure of the global investment-grade fixed income markets.

The Bloomberg US Corporate High Yield Index measures the market of USD-denominated, non-investment grade, fixed-rate, taxable corporate bonds. Securities are classified as high yield if the middle rating of Moody’s, Fitch, and S&P is Ba1/BB+/BB+ or below. The index excludes emerging market debt.

The Bloomberg US Corporate Index is a broad-based benchmark that measures the investment grade, fixed-rate, taxable, corporate bond market.

The Bloomberg US Mortgage-Backed Securities (MBS) Index tracks agency mortgage-backed pass-through securities (both fixed-rate and hybrid ARM) guaranteed by Ginnie Mae (GNMA), Fannie Mae (FNMA) and Freddie Mac (FHLMC). The index is constructed by grouping individual TBA-deliverable MBS pools into aggregates or generics based on program, coupon, and vintage. Introduced in 1985, the GNMA, FHLMC and FNMA fixed-rate indexes for 30- and 15-year securities were backdated to January 1976, May 1977, and November 1982, respectively. In April 2007, agency hybrid adjustable-rate mortgage (ARM) pass-through securities were added to the index.

Consumer Price Index (CPI) is a measure that examines the weighted average of prices of a basket of consumer goods and services, such as transportation, food, and medical care.

Euro vs. USD—Euro total return versus U.S. dollar.

German 10YR bonds—Germany Benchmark 10-Year Datastream Government Index; Japan 10YR government bonds —Japan Benchmark 10-Year Datastream Government Index; and 10YR US Treasury—US Benchmark 10-Year Datastream Government Index.

The ICE BofAML European Currency High-Yield Constrained Index (ICE BofAML Euro HY constrained) is designed to track the performance of euro- and British pound sterling-denominated below investment-grade corporate debt publicly issued in the Eurobond, sterling.

The ICE BofAML US Mortgage-Backed Securities (ICE BofAML US Mortgage Master) Index tracks the performance of US dollar-denominated, fixed-rate and hybrid residential mortgage pass-through securities publicly issued by US agencies in the US domestic market.

The ICE BofAML US High Yield Master II Constrained Index (ICE BofAML US High Yield) is a market value-weighted index of all domestic and Yankee high-yield bonds, including deferred-interest bonds and payment-in-kind securities. Its securities have maturities of one year or more and a credit rating lower than BBB-/Baa3 but are not in default.

The ISM Manufacturing Index is based on surveys of more than 300 manufacturing firms by the Institute of Supply Management. The ISM Manufacturing Index monitors employment, production inventories, new orders, and supplier deliveries. A composite diffusion index is created that monitors conditions in national manufacturing based on the data from these surveys.

Italy 10-Year Government Bonds—Italy Benchmark 10-Year Datastream Government Index.

The JP Morgan CEMBI Broad Diversified Index is a global, liquid corporate emerging markets benchmark that tracks US-denominated corporate bonds issued by emerging markets entities.

The JPMorgan Government Bond Index—emerging markets (JPM local EM debt) tracks local currency bonds issued by emerging market governments. The index is positioned as the investable benchmark that includes only those countries that are accessible by most of the international investor base (excludes China and India as of September 2013).

The JPMorgan Government Bond Index Emerging Markets (JPM External EM Debt) tracks local currency bonds issued by emerging market governments. The index is positioned as the investable benchmark that includes only those countries that are accessible by most of the international investor base (excludes China and India as of September 2013).

The JP Morgan Emerging Markets Bond Index Global (EMBI Global) tracks total returns for traded external debt instruments in the emerging markets and is an expanded version of the EMBI+. As with the EMBI+, the EMBI Global includes US dollar-denominated Brady bonds, loans, and Eurobonds with an outstanding face value of at least $500 million.

The JP Morgan GBI-EM Global Diversified Index is a market-capitalization weighted, liquid global benchmark for US-dollar corporate emerging market bonds representing Asia, Latin America, Europe, and the Middle East/Africa.

JPY vs. USD—Japanese yen total return versus US dollar.

The Markit ITraxx Europe Index comprises 125 equally weighted credit default swaps on investment grade European corporate entities, distributed among 4 sub-indices: Financials (Senior & Subordinated), Non-Financials and HiVol.

The Nikkei 225 Index (Japan Nikkei 225) is a price-weighted index of Japan’s top 225 blue-chip companies on the Tokyo Stock Exchange.

The MSCI AC Asia ex-Japan Index (MSCI Asia ex-Japan) captures large- and mid-cap representation across two of three developed markets countries (excluding Japan) and eight emerging markets countries in Asia.

The MSCI All Country World Index (ACWI, MSCI global equities) is a free float-adjusted market capitalization weighted index designed to measure the equity market performance of developed and emerging markets. The term "free float" represents the portion of shares outstanding that are deemed to be available for purchase in the public equity markets by investors. The performance of the Index is listed in US dollars and assumes reinvestment of net dividends.

MSCI Emerging Markets Index (MSCI emerging equities) captures large- and mid-cap representation across 23 emerging markets (EM) countries.

The MSCI World Index (MSCI developed equities) captures large and mid-cap representation across 23 developed market (DM) countries.

Purchasing Managers Index (PMI) is an indicator of the economic health of the manufacturing sector.

The Refinitiv Convertible Global Focus USD Hedged Index is a market weighted index with a minimum size for inclusion of $500 million (US), 200 million (Europe), 22 billion Yen, and $275 million (Other) of Convertible Bonds with an Equity Link.

The Russell 2000® Index is an index that measures the performance of the 2,000 smallest companies in the Russell 3000 Index.

The S&P 500® Index (US S&P 500) measures the performance of the large-cap segment of the US equities market, covering approximately 75 percent of the US equities market. The index includes 500 leading companies in leading industries of the U.S. economy.

S&P CoreLogic Case-Shiller US National Home Price NSA Index seeks to measure the value of residential real estate in 20 major US metropolitan areas: Atlanta, Boston, Charlotte, Chicago, Cleveland, Dallas, Denver, Detroit, Las Vegas, Los Angeles, Miami, Minneapolis, New York, Phoenix, Portland, San Diego, San Francisco, Seattle, Tampa and Washington, D.C.

The S&P/LSTA US Leveraged Loan 100 Index (S&P/LSTA Leveraged Loan Index) is designed to reflect the performance of the largest facilities in the leveraged loan market.

The S&P GSCI Copper Index (Copper), a sub-index of the S&P GSCI, provides investors with a reliable and publicly available benchmark for investment performance in the copper commodity market.

The S&P GSCI Softs (GSCI soft commodities) Index is a sub-index of the S&P GSCI that measures the performance of only the soft commodities, weighted on a world production basis. In 2012, the S&P GSCI Softs Index included the following commodities: coffee, sugar, cocoa, and cotton.

Spain 10-Year Government Bonds—Spain Benchmark 10-Year Datastream Government Index.

The Thomson Reuters Convertible Global Focus USD Hedged Index is a market weighted index with a minimum size for inclusion of $500 million (US), 200 million euro (Europe), 22 billion yen, and $275 million (Other) of convertible bonds with an equity link.

U.K. 10YR government bonds—U.K. Benchmark 10-Year Datastream Government Index. For the following Datastream government bond indexes, benchmark indexes are based on single bonds. The bond chosen for each series is the most representative bond available for the given maturity band at each point in time. Benchmarks are selected according to the accepted conventions within each market. Generally, the benchmark bond is the latest issue within the given maturity band; consideration is also given to yield, liquidity, issue size and coupon.

The US Dollar Index (DXY) is an index of the value of the United States dollar relative to a basket of foreign currencies, often referred to as a basket of US trade partners’ currencies.

The Chicago Board Options Exchange (CBOE) Market Volatility (VIX) Index shows the market’s expectation of 30-day volatility.

There is no guarantee that any investment strategy will work under all market conditions, and each investor should evaluate their ability to invest for the long-term, especially during periods of downturn in the market.

A separately managed account may not be appropriate for all investors. Separate accounts managed according to the particular strategy may include securities that may not necessarily track the performance of a particular index. Please consider the investment objectives, risks and fees of the Strategy carefully before investing. A minimum asset level is required. For important information about the investment managers, please refer to Form ADV Part 2.

The views and opinions and/or analysis expressed are those of the author or the investment team as of the date of preparation of this material and are subject to change at any time without notice due to market or economic conditions and may not necessarily come to pass. Furthermore, the views will not be updated or otherwise revised to reflect information that subsequently becomes available or circumstances existing, or changes occurring, after the date of publication. The views expressed do not reflect the opinions of all investment personnel at Morgan Stanley Investment Management (MSIM) and its subsidiaries and affiliates (collectively “the Firm”) and may not be reflected in all the strategies and products that the Firm offers.

Forecasts and/or estimates provided herein are subject to change and may not actually come to pass. Information regarding expected market returns and market outlooks is based on the research, analysis and opinions of the authors or the investment team. These conclusions are speculative in nature, may not come to pass and are not intended to predict the future performance of any specific strategy or product the Firm offers. Future results may differ significantly depending on factors such as changes in securities or financial markets or general economic conditions.

This material has been prepared on the basis of publicly available information, internally developed data and other third-party sources believed to be reliable. However, no assurances are provided regarding the reliability of such information and the Firm has not sought to independently verify information taken from public and third-party sources.

This material is a general communication, which is not impartial, and all information provided has been prepared solely for informational and educational purposes and does not constitute an offer or a recommendation to buy or sell any particular security or to adopt any specific investment strategy. The information herein has not been based on a consideration of any individual investor circumstances and is not investment advice, nor should it be construed in any way as tax, accounting, legal or regulatory advice. To that end, investors should seek independent legal and financial advice, including advice as to tax consequences, before making any investment decision.

Charts and graphs provided herein are for illustrative purposes only. Past performance is no guarantee of future results.

The indexes are unmanaged and do not include any expenses, fees, or sales charges. It is not possible to invest directly in an index. Any index referred to herein is the intellectual property (including registered trademarks) of the applicable licensor. Any product based on an index is in no way sponsored, endorsed, sold, or promoted by the applicable licensor and it shall not have any liability with respect thereto.

This material is not a product of Morgan Stanley’s Research Department and should not be regarded as a research material or a recommendation.

The Firm has not authorized financial intermediaries to use and to distribute this material unless such use and distribution is made in accordance with applicable law and regulation. Additionally, financial intermediaries are required to satisfy themselves that the information in this material is appropriate for any person to whom they provide this material in view of that person’s circumstances and purpose. The Firm shall not be liable for, and accepts no liability for, the use or misuse of this material by any such financial intermediary.

This material may be translated into other languages. Where such a translation is made this English version remains definitive. If there are any discrepancies between the English version and any version of this material in another language, the English version shall prevail.

The whole or any part of this material may not be directly or indirectly reproduced, copied, modified, used to create a derivative work, performed, displayed, published, posted, licensed, framed, distributed, or transmitted or any of its contents disclosed to third parties without the Firm’s express written consent. This material may not be linked to unless such hyperlink is for personal and non-commercial use. All information contained herein is proprietary and is protected under copyright and other applicable law.

Eaton Vance is part of Morgan Stanley Investment Management. Morgan Stanley Investment Management is the asset management division of Morgan Stanley.

DISTRIBUTION

This material is only intended for and will only be distributed to persons resident in jurisdictions where such distribution or availability would not be contrary to local laws or regulations.

MSIM, the asset management division of Morgan Stanley (NYSE: MS), and its affiliates have arrangements in place to market each other’s products and services. Each MSIM affiliate is regulated as appropriate in the jurisdiction it operates. MSIM’s affiliates are: Eaton Vance Management (International) Limited, Eaton Vance Advisers International Ltd, Calvert Research and Management, Eaton Vance Management, Parametric Portfolio Associates LLC, and Atlanta Capital Management LLC.

This material has been issued by any one or more of the following entities:

EMEA:

This material is for Professional Clients/Accredited Investors only.

In the EU, MSIM and Eaton Vance materials are issued by MSIM Fund Management (Ireland) Limited (“FMIL”). FMIL is regulated by the Central Bank of Ireland and is incorporated in Ireland as a private company limited by shares with company registration number 616661 and has its registered address at 24-26 City Quay, Dublin 2, D02 NY 19, Ireland.

Outside the EU, MSIM materials are issued by Morgan Stanley Investment Management Limited (MSIM Ltd) is authorised and regulated by the Financial Conduct Authority. Registered in England. Registered No. 1981121. Registered Office: 25 Cabot Square, Canary Wharf, London E14 4QA.

In Switzerland, MSIM materials are issued by Morgan Stanley & Co. International plc, London (Zurich Branch) Authorised and regulated by the Eidgenössische Finanzmarktaufsicht ("FINMA"). Registered Office: Beethovenstrasse 33, 8002 Zurich, Switzerland.

Outside the US and EU, Eaton Vance materials are issued by Eaton Vance Management (International) Limited (“EVMI”) 125 Old Broad Street, London, EC2N 1AR, UK, which is authorised and regulated in the United Kingdom by the Financial Conduct Authority.

Italy: MSIM FMIL (Milan Branch), (Sede Secondaria di Milano) Palazzo Serbelloni Corso Venezia, 16 20121 Milano, Italy. The Netherlands: MSIM FMIL (Amsterdam Branch), Rembrandt Tower, 11th Floor Amstelplein 1 1096HA, Netherlands. France: MSIM FMIL (Paris Branch), 61 rue de Monceau 75008 Paris, France. Spain: MSIM FMIL (Madrid Branch), Calle Serrano 55, 28006, Madrid, Spain. Germany: Germany: MSIM FMIL (Frankfurt Branch), Grosse Gallusstrasse 18, 60312 Frankfurt am Main, Germany (Gattung: Zweigniederlassung (FDI) gem. § 53b KWG). Denmark: MSIM FMIL (Copenhagen Branch), Gorrissen Federspiel, Axel Towers, Axeltorv2, 1609 Copenhagen V, Denmark.

MIDDLE EAST

Dubai: MSIM Ltd (Representative Office, Unit Precinct 3-7th Floor-Unit 701 and 702, Level 7, Gate Precinct Building 3, Dubai International Financial Centre, Dubai, 506501, United Arab Emirates. Telephone: +97 (0)14 709 7158). This document is distributed in the Dubai International Financial Centre by Morgan Stanley Investment Management Limited (Representative Office), an entity regulated by the Dubai Financial Services Authority (“DFSA”). It is intended for use by professional clients and market counterparties only. This document is not intended for distribution to retail clients, and retail clients should not act upon the information contained in this document.

This document relates to a financial product which is not subject to any form of regulation or approval by the DFSA. The DFSA has no responsibility for reviewing or verifying any documents in connection with this financial product. Accordingly, the DFSA has not approved this document or any other associated documents nor taken any steps to verify the information set out in this document and has no responsibility for it. The financial product to which this document relates may be illiquid and/or subject to restrictions on its resale or transfer. Prospective purchasers should conduct their own due diligence on the financial product. If you do not understand the contents of this document, you should consult an authorized financial adviser.

US

NOT FDIC INSURED | OFFER NO BANK GUARANTEE | MAY LOSE VALUE | NOT INSURED BY ANY FEDERAL GOVERNMENT AGENCY | NOT A DEPOSIT

Latin America (Brazil, Chile Colombia, Mexico, Peru, and Uruguay)

This material is for use with an institutional investor or a qualified investor only. All information contained herein is confidential and is for the exclusive use and review of the intended addressee and may not be passed on to any third party. This material is provided for informational purposes only and does not constitute a public offering, solicitation, or recommendation to buy or sell for any product, service, security and/or strategy. A decision to invest should only be made after reading the strategy documentation and conducting in-depth and independent due diligence.

ASIA PACIFIC

Hong Kong: This material is disseminated by Morgan Stanley Asia Limited for use in Hong Kong and shall only be made available to “professional investors” as defined under the Securities and Futures Ordinance of Hong Kong (Cap 571). The contents of this material have not been reviewed nor approved by any regulatory authority including the Securities and Futures Commission in Hong Kong. Accordingly, save where an exemption is available under the relevant law, this material shall not be issued, circulated, distributed, directed at, or made available to, the public in Hong Kong. Singapore: This material is disseminated by Morgan Stanley Investment Management Company and may not be circulated or distributed, whether directly or indirectly, to persons in Singapore other than to (i) an accredited investor (ii) an expert investor or (iii) an institutional investor as defined in Section 4A of the Securities and Futures Act, Chapter 289 of Singapore (“SFA”); or (iv) otherwise pursuant to, and in accordance with the conditions of, any other applicable provision of the SFA. This publication has not been reviewed by the Monetary Authority of Singapore. Australia: This material is provided by Morgan Stanley Investment Management (Australia) Pty Ltd ABN 22122040037, AFSL No. 314182 and its affiliates and does not constitute an offer of interests. Morgan Stanley Investment Management (Australia) Pty Limited arranges for MSIM affiliates to provide financial services to Australian wholesale clients. Interests will only be offered in circumstances under which no disclosure is required under the Corporations Act 2001 (Cth) (the “Corporations Act”). Any offer of interests will not purport to be an offer of interests in circumstances under which disclosure is required under the Corporations Act and will only be made to persons who qualify as a “wholesale client” (as defined in the Corporations Act). This material will not be lodged with the Australian Securities and Investments Commission.

Japan:

For professional investors, this document is circulated or distributed for informational purposes only. For those who are not professional investors, this document is provided in relation to Morgan Stanley Investment Management (Japan) Co., Ltd. (“MSIMJ”)’s business with respect to discretionary investment management agreements (“IMA”) and investment advisory agreements (“IAA”). This is not for the purpose of a recommendation or solicitation of transactions or offers any particular financial instruments. Under an IMA, with respect to management of assets of a client, the client prescribes basic management policies in advance and commissions MSIMJ to make all investment decisions based on an analysis of the value, etc. of the securities, and MSIMJ accepts such commission. The client shall delegate to MSIMJ the authorities necessary for making investment. MSIMJ exercises the delegated authorities based on investment decisions of MSIMJ, and the client shall not make individual instructions. All investment profits and losses belong to the clients; principal is not guaranteed. Please consider the investment objectives and nature of risks before investing. As an investment advisory fee for an IAA or an IMA, the amount of assets subject to the contract multiplied by a certain rate (the upper limit is 2.20% per annum (including tax)) shall be incurred in proportion to the contract period. For some strategies, a contingency fee may be incurred in addition to the fee mentioned above. Indirect charges also may be incurred, such as brokerage commissions for incorporated securities. Since these charges and expenses are different depending on a contract and other factors, MSIMJ cannot present the rates, upper limits, etc. in advance. All clients should read the Documents Provided Prior to the Conclusion of a Contract carefully before executing an agreement. This document is disseminated in Japan by MSIMJ, Registered No. 410 (Director of Kanto Local Finance Bureau (Financial Instruments Firms)), Membership: The Japan Securities Dealers Association, the Investment Trusts Association, Japan, the Japan Investment Advisers Association, and the Type II Financial Instruments Firms Association.