We believe the extreme concentration found in U.S. equity markets, where a few holdings dominate returns, is unsustainable. When this trend breaks, it could mark the beginning of a "sweet spot" for diversified, high-quality portfolios,1 with investors turning toward more traditional measures of corporate strength, such as earnings growth and solid fundamentals.
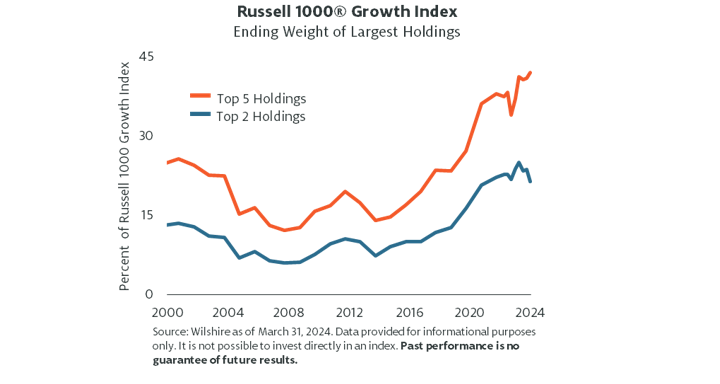
In recent years, we've pointed to the massive concentration of a few holdings driving U.S. equity index returns — whether it's the S&P 500 or the Russell 1000® Growth (exhibit 1). While many equity index returns were ruled by a group of stocks termed the "Magnificent Seven" in 2023, results for the first quarter of 2024 were even more concentrated. Four stocks — Nvidia, Microsoft, Meta and Amazon — accounted for more than 69% of the Russell 1000 Growth Index's return. If the pendulum swings back from the favored few, diversified portfolios of high-quality companies with consistent earnings growth should benefit. Pursuing strategies with high active share2 and a differentiated exposure could be even more beneficial.
Exhibit 1: Russell 1000® Growth: Extreme Concentration in Recent Years

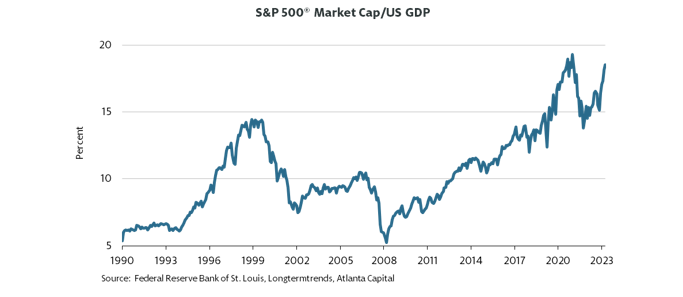
Buffett indicator approaching all-time high
Along with market concentration, equity markets have once again become expensive since late 2022. Looking across a range of valuation metrics — whether price-to-earnings (P/E) ratio, price-to-book, or price-to-free-cash-flow — these generally have been sitting at elevated levels relative to their long-term averages. Even more telling of the market's richness, we think, is the S&P 500 market-capitalization-to-GDP ratio, the so-called "Buffett Indicator." This ratio is used to determine whether an overall market is undervalued or overvalued compared to a historical average. It reached a new peak in 2021 before falling during the 2022 correction and is now approaching the all-time high once again (exhibit 2). With valuation metrics at these levels, it may be prudent for investors to think about downside protection instead of purely focusing on upside participation.
Exhibit 2: U.S. Stock Market Nearing Record-High Expensiveness

Low-quality volatility and the case for high quality
Over the past four years, low-quality stock valuations have been very volatile. In 2020 and 2021, the market's low-quality tilt was a driver of high valuations and market expensiveness. The divergence between low-quality and high-quality stock valuations peaked in 2021, spurred by aggressive fiscal policy during COVID, along with the Federal Reserve's near-zero interest rate policy. Before this period, we saw low-quality stocks valued so highly (on a P/E basis) only two other times: during 2008-2009 and in the late 1990s.
In 2022, U.S. equity markets corrected meaningfully, especially low-quality stocks. At that time, high-quality stocks provided investors significant downside protection. In late 2022 and the first half of 2023, low-quality valuations bounced back due to speculation and optimism about the potential of artificial intelligence and weight-loss drugs. Today, low-quality P/Es remain elevated, and while past market actions cannot be seen as predictive of the future, we believe high quality could be well positioned moving forward. As expected, throughout this four-year period, high-quality valuations remained more stable and consistent.
In terms of sound investment strategy, we continue to believe investors will be well served by a diversified, high-quality portfolio, particularly ones with high active share. With markets near all-time highs, stock valuations above average, and index concentrations at historic levels, we may be approaching a market transition in which high quality returns to favor.
Bottom line: A range of market factors point to a potentially improved environment for high-quality investors. In view of high market concentration, high valuations, economic uncertainty and ongoing volatility, investors may benefit from seeking higher-quality, sound businesses with demonstrable, consistent earnings and sound balance sheets versus their lower-quality counterparts.
1 Higher-quality companies typically have consistent earnings, strong balance sheets, significant free-cash-flow generation, growing revenues and meaningful competitive advantages, whereas the opposite is true for their lower-quality counterparts. Historically, high-quality equities have outperformed over full market cycles.
2 Active share is a measure of the percentage of stock holdings in a portfolio that differs from the benchmark index. A high active share score is said to indicate that a portfolio's holdings diverge from the target index and that the portfolio manager is outperforming it.
Index definitions:
S&P 500® Index is an unmanaged index of large cap stocks commonly used as a measure of U.S. stock market performance.
Russell 1000® Growth Index is an unmanaged index of U.S. large cap growth stocks.


