


Since the People's Bank of China (PBOC) announced a rate cut and other stimulus on September 24, two questions on investors' minds have been: 1) Will they do fiscal stimulus of RMB (Chinese Renminbi) 2, 5 or 10 trillion? and 2) Will they chase or fade the rally in Chinese stocks? To answer these questions, it is important first to diagnose the underlying problem and, second, to identify the proper solution.
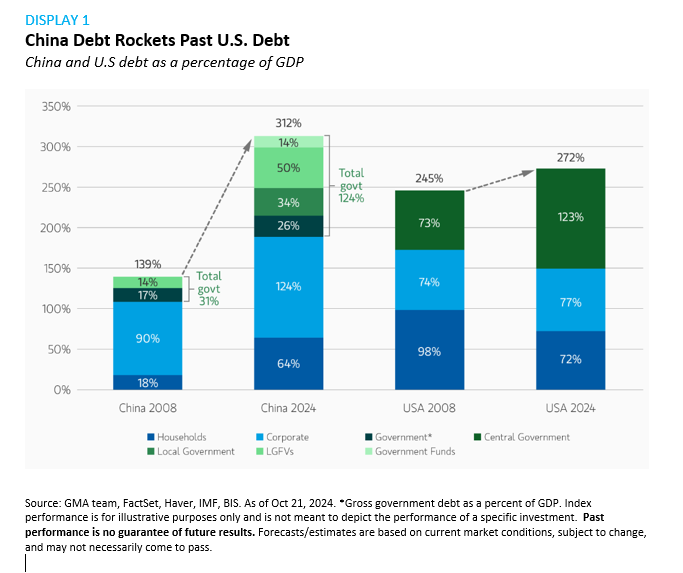
THE PROBLEM: China is suffering from debt deflation, the result of a debt-fueled fixed investment bubble. The original sin was setting excessive GDP growth targets (6-8% in the 2010s and 5% today) that were aimed at transforming China into a first-world economy, without regard for its underlying capacity (China's labor force and population are declining). To meet growth targets, massive investment funded by debt has been directed at the property, manufacturing and infrastructure sectors: investment averaged 43% of China's GDP over the past decade (versus 32-36% at the peak of Japan and Korea's investment bubbles in the 1980s and 1990s). The result is overcapacity and one of the world's largest debt loads at more than 300% of GDP—see Display 1.
The property market has been in contraction for three years, with home sales and starts down 50-70%. Investment in infrastructure and the "New Three" industries1 helped to offset this, but are coming under pressure: local governments have fewer resources to invest in infrastructure and New Three capacity in China is already more than twice global demand. Households, under pressure from job losses, wage cuts and the hit to their wealth from property price declines, have curtailed spending. Bank lending has been steadily decelerating due to lending officers' caution and a lack of demand from overindebted households, corporations and local governments. The net result is the Chinese economy has been in deflation for seven out of the past eight quarters.
THE SOLUTION: As a classic debt-fueled investment boom (though among the largest), China requires a comprehensive solution based on the lessons learned from other debt busts, such as Japan, the U.S. Savings and Loan (S&L) crisis, the Global Financial Crisis (GFC) and the Eurozone periphery. The five main elements are well known: 1) identifying and segregating bad debts, 2) recapitalizing banks, and, in China's case, local governments, 3) very easy monetary policy—usually zero rates, 4) a weaker exchange rate to regain competitiveness, and 5) judicious fiscal stimulus—as consumer subsidies like cash-for-clunkers only front-load demand, and additional overinvestment in infrastructure and manufacturing capacity exacerbates existing imbalances.
Most countries take years to eventually achieve all five because it is expensive, complex and politically difficult: the U.S. S&L crisis took nine years to resolve, Japan was still recapitalizing its banks 12 years after the peak of its bubble, and Greece was bailed out three times over six years. The GFC was resolved more quickly in the U.S. as most major banks started running out of liquidity and capital due to mark-to-market losses on collapsing mortgage-backed securities, forcing a more immediate government response. The more banks are allowed to extend and pretend, the longer the crisis takes to resolve. But eventually everyone ends up in the same place.
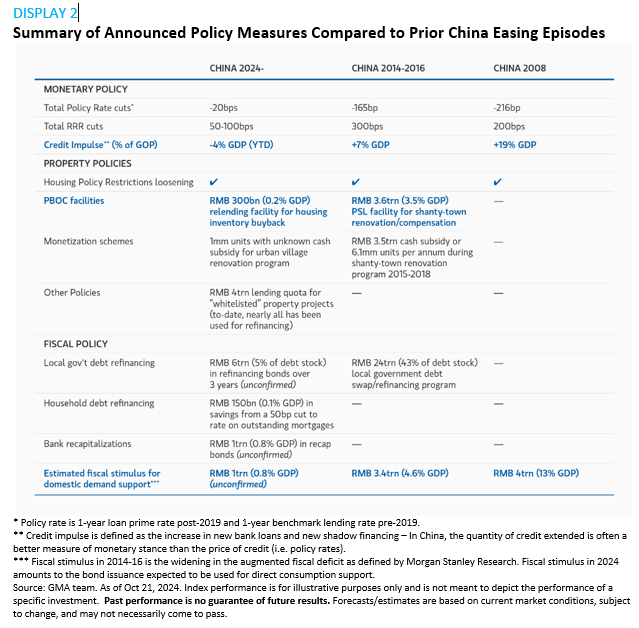
In that context, despite the fanfare and press conferences held by almost every agency of the Chinese government and the strong initial market reaction,2 it is clear that the announced measures are nowhere near a comprehensive solution for China's economy3—see Display 2. They will most likely result in a modest, short-lived economic rebound in the current quarter and possibly the next.
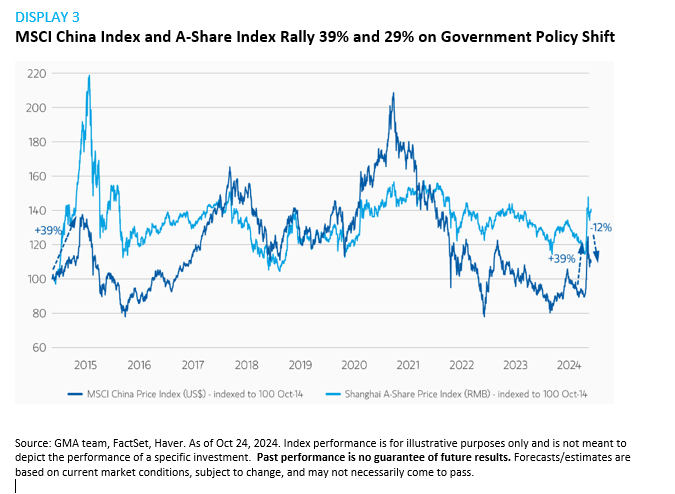
China stock market bulls point to a clear shift in the reaction function of policymakers, very cheap stocks and low positioning. Our take is that:
- Chinese stocks only look cheap because State-Owned Enterprise (SOE) banks trade at below 5x forward earnings (rightfully so, given undisclosed NPLs and their SOE status). Excluding financials, MSCI China stocks trade at 13x, about 2 points below EU, Japan and EM ex-China (all ex-financials). Given the Chinese government's increasing interventionism in the private sector, such a discount appears warranted (Korea trades at 9x, in part for similar reasons).
- Positioning in Chinese stocks is indeed relatively low due to investor skepticism (with the exception of a spike during the initial rally).
There has been a radical shift in policymakers' approach to the current economic crisis in China. But it is rarely the first step in policy easing which catalyzes a durable equity market rally. For example, the U.S. Fed first cut the discount rate in August 2007 but the market did not trough for another 1.5 years; Japan bailed out its first bank in 1991 and its last in 2003; the Eurozone started bailouts two years before Mario Draghi's "whatever it takes" speech in July 2012, which itself only ended the EMU peripheral crisis because an unlimited bond buying program was announced two weeks later.4 In each case, markets began sustainably recovering because economic activity began sustainably recovering following sufficient policy support.
Bottom line: The shift in China's policymakers' tone has been dramatic, but actions so far represent only a modest step in the direction of what will ultimately be required. Chinese stocks are likely still under-owned by local and global investors but their superficially low multiples do not represent a compelling reason to go overweight China until policy measures sufficient to solve its debt deflation problems are implemented—fade the stock rally.
1 The "New Three" industries are Solar Cell, Electric Vehicles and Lithium Batteries.
2 The recent rally in offshore Chinese equities was on par with the 2014-15 bubble in Chinese equities and the on-shore equities rally resulted in all-time high trading volumes on the Shanghai and Shenzhen exchanges.
3 For example, the proposal for a RMB 1trn capital injection for Chinese banks sounds large, but is not game-changing in the context of the RMB 417 trillion in assets of the Chinese banking system.
4 The OMT (Outright Monetary Transactions) program was announced on August 2, 2012 by the ECB (with the technical specifications following a month later on September 6, 2012).
Featured Insights


Risk considerations: The views and opinions and/or analysis expressed are those of the author or the investment team as of the date of preparation of this material and are subject to change at any time without notice due to market or economic conditions and may not necessarily come to pass. Furthermore, the views will not be updated or otherwise revised to reflect information that subsequently becomes available or circumstances existing, or changes occurring, after the date of publication. The views expressed do not reflect the opinions of all investment personnel at Morgan Stanley Investment Management (MSIM) and its subsidiaries and affiliates (collectively "the Firm"), and may not be reflected in all the strategies and products that the Firm offers.
Forecasts and/or estimates provided herein are subject to change and may not actually come to pass. Information regarding expected market returns and market outlooks is based on the research, analysis and opinions of the authors or the investment team. These conclusions are speculative in nature, may not come to pass and are not intended to predict the future performance of any specific strategy or product the Firm offers. Future results may differ significantly depending on factors such as changes in securities or financial markets or general economic conditions.
This material has been prepared on the basis of publicly available information, internally developed data and other third-party sources believed to be reliable. However, no assurances are provided regarding the reliability of such information and the Firm has not sought to independently verify information taken from public and third-party sources.
This material is a general communication, which is not impartial and all information provided has been prepared solely for informational and educational purposes and does not constitute an offer or a recommendation to buy or sell any particular security or to adopt any specific investment strategy. The information herein has not been based on a consideration of any individual investor circumstances and is not investment advice, nor should it be construed in any way as tax, accounting, legal or regulatory advice. To that end, investors should seek independent legal and financial advice, including advice as to tax consequences, before making any investment decision.
Charts and graphs provided herein are for illustrative purposes only. Past performance is no guarantee of future results. The indexes are unmanaged and do not include any expenses, fees or sales charges. It is not possible to invest directly in an index. Any index referred to herein is the intellectual property (including registered trademarks) of the applicable licensor. Any product based on an index is in no way sponsored, endorsed, sold or promoted by the applicable licensor and it shall not have any liability with respect thereto.