


KEY POINTS
1. High yield municipal bonds are positioned to benefit from the favorable fundamental and technical backdrop that buoyed performance over 2023 and the first half of 2024.
2. Yields remain attractive on a relative and historic basis, with the yield on the Bloomberg High Yield Municipal Bond Index currently at 5.43%.
3. Current and historical trends suggest that investors may want to consider adding high yield municipal bonds to their portfolios as a core allocation.
Boston - Through the first half of 2024, the Municipal High Yield Index returned 4.14%, outperforming the main Municipal Index by 454 basis points and making the sector among the best performers within fixed income.1 While impressive, the sector's outperformance is not unusual and remains in keeping with longer term trends. Looking ahead to 2024's second half, we foresee continued space for optimism toward high yield munis.
High yield municipals outperformed over longer term
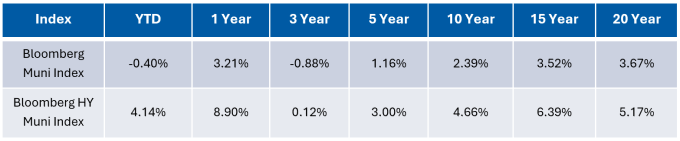
Source: Bloomberg. As of 6/30/2024. Data provided for informational purposes only. It is not possible to invest directly in an index. Past performance is no guarantee of future results.
Fundamentals staying strong
In 2024, fundamentals for municipal credit have followed on from 2023's strong showing, with improved metrics for credit quality supported by a healthy macro backdrop.
Credit upgrades/downgrades - In 2023, Moody's upgraded 3.6x more credits than they downgraded, which was the highest full-year ratio since 2007.2 The positive trends have continued in 2024, as the rating agencies have upgraded 2x more credits than they have downgraded.
Defaults - Municipal defaults have now declined for three years in a row, from 89 unique defaults in 2020 to just 53 unique defaults in 2023. Through the first six months of 2024, defaults have declined further, to just 25 unique defaults compared to 28 the prior year.3
Economic backdrop - The strong state of muni credit, combined with the resilient economy has led to credit spreads tightening throughout 2024. If a soft landing in the economy were to occur, credit spreads could continue tightening in the second half of the year.
Technicals remain robust
A tighter supply of high yield muni issuance combined with strong inflows into high yield muni funds ($7.4 billion)4 has resulted in a positive technical tailwind for the HY muni market over the first half of 2024.
In the January to June period, the broad muni primary market bond issuance hit a record for the first half of any year. Issuance totaled $236 billion in the period, an increase of 37% on the prior year. In contrast, high yield muni issuance totaled just $11 billion, a continuation of the declining issuance trend for the sector over recent years. At these levels, full-year 2024 looks set to come in at roughly one half the average for the past 17 years of $42 billion.
Decreasing issuance keeps high yield muni market tight
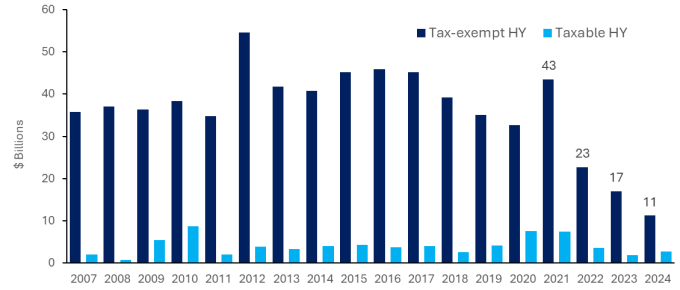
Source: J.P. Morgan. As of 6/30/2024. Past performance is no guarantee of future results.
Yield appeal
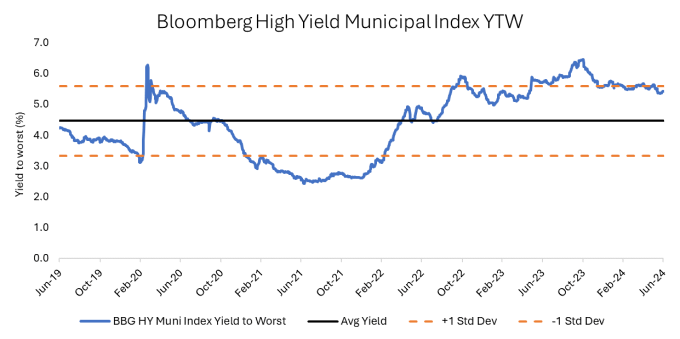
Despite high yield munis' outperformance in recent years, yields remain attractive. The Bloomberg High Yield Municipal Bond Index currently yields 5.43%, up 231 basis points from 2022's start and 73 basis points above the average index yield of the past five years.5 In addition, on a taxable equivalent basis for a top-rate earner paying a rate of 40.8% (37% plus 3.8% on net investible income), the Bloomberg High Yield Municipal Bond Index currently yields over 9.17%, making it one of the highest yielding sectors in fixed income.
Yields remain highly attractive
Bottom Line: Strong credit fundamentals, positive technical factors (low issuance and strong fund inflows) and attractive yields make the outlook for high yield municipal bonds appear bright. The sector merits consideration, in our view, as a core fixed income allocation for investors seeking strong income and capital upside potential.
1 Bloomberg. As of 6/30/2024.
2 Moody's. As of 6/30/2024.
3 Moody's. As of 6/30/2024.
4 Refinitiv. As of 6/30/2024.
5 Bloomberg. As of 6/30/2024.
Definitions:
Bloomberg High Yield Municipal Bond Index is an unmanaged index of non-Investment Grade Municipal bonds traded in the U.S.
Bloomberg Municipal Bond Index is an unmanaged index of municipal bonds traded in the U.S.
Yield-To-Worst is the lowest potential yield that can be received on a bond without the issuer actually defaulting. The yield to worst is calculated by making worst-case scenario assumptions on the issue by calculating the returns that would be received if provisions, including prepayment, call or sinking fund, are used by the issuer.
Past performance is no guarantee of future results. The index performance is provided for illustrative purposes only and is not meant to depict the performance of a specific investment.
Featured Insights


Risk Considerations: Investments in high yield are those rated below investment grade (sometimes referred to as "junk") and are typically subject to greater price volatility and illiquidity than higher rated investments. An imbalance in supply and demand in the municipal market may result in valuation uncertainties and greater volatility, less liquidity, widening credit spreads and a lack of price transparency in the market. There generally is limited public information about municipal issuers. Investments in income securities may be affected by changes in the creditworthiness of the issuer and are subject to the risk of non-payment of principal and interest. The value of income securities also may decline because of real or perceived concerns about the issuer's ability to make principal and interest payments. As interest rates rise, the value of certain income investments is likely to decline. Investments involving higher risk do not necessarily mean higher return potential.
The views and opinions and/or analysis expressed are those of the author or the investment team as of the date of preparation of this material and are subject to change at any time without notice due to market or economic conditions and may not necessarily come to pass. Furthermore, the views will not be updated or otherwise revised to reflect information that subsequently becomes available or circumstances existing, or changes occurring, after the date of publication. The views expressed do not reflect the opinions of all investment personnel at Morgan Stanley Investment Management (MSIM) and its subsidiaries and affiliates (collectively “the Firm”), and may not be reflected in all the strategies and products that the Firm offers.
Forecasts and/or estimates provided herein are subject to change and may not actually come to pass. Information regarding expected market returns and market outlooks is based on the research, analysis and opinions of the authors or the investment team. These conclusions are speculative in nature, may not come to pass and are not intended to predict the future performance of any specific strategy or product the Firm offers. Future results may differ significantly depending on factors such as changes in securities or financial markets or general economic conditions.
This material has been prepared on the basis of publicly available information, internally developed data and other third-party sources believed to be reliable. However, no assurances are provided regarding the reliability of such information and the Firm has not sought to independently verify information taken from public and third-party sources.
This material is a general communication, which is not impartial and all information provided has been prepared solely for informational and educational purposes and does not constitute an offer or a recommendation to buy or sell any particular security or to adopt any specific investment strategy. The information herein has not been based on a consideration of any individual investor circumstances and is not investment advice, nor should it be construed in any way as tax, accounting, legal or regulatory advice. To that end, investors should seek independent legal and financial advice, including advice as to tax consequences, before making any investment decision.
Charts and graphs provided herein are for illustrative purposes only. Past performance is no guarantee of future results. The indexes are unmanaged and do not include any expenses, fees or sales charges. It is not possible to invest directly in an index. Any index referred to herein is the intellectual property (including registered trademarks) of the applicable licensor. Any product based on an index is in no way sponsored, endorsed, sold or promoted by the applicable licensor and it shall not have any liability with respect thereto.