


A decade of extremely low interest rates followed by the Federal Reserve's aggressive policy normalization created a challenging environment for bond investors over the last two years. We see the environment for fixed income improving greatly from here for these reasons:
KEY POINTS
1. Income: Starting yields are near post-financial crisis highs and have been a reliable indicator of future returns.
2. Total Return: The Fed has signaled a pivot from its restrictive stance, which has historically been a compelling time to increase duration in fixed income allocations.
3. Diversification: Correlations between bonds and risk assets should normalize as the Fed cuts interest rates.
Against this backdrop, we believe multi-sector core and core plus strategies will generate attractive total returns and reclaim their traditional and critical role of providing investors with income and portfolio diversification. Active strategies with sector and quality flexibility have the best return prospects, in our opinion, given the broad range of uncertainties facing markets in 2024.
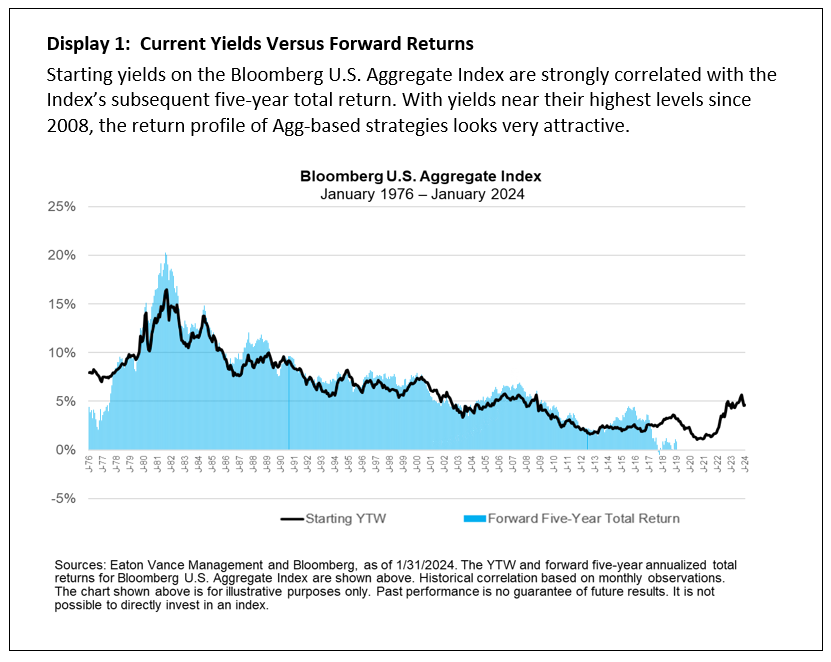
Starting yields are near post-financial crisis highs.
Bond yields have surged over the past two years amid the most aggressive (both in magnitude and speed) Fed tightening since the 1980s. While yields have pulled back from recent highs, there is still a significant amount of total return to be made from current yield levels. And compared to equities, total returns tend to be less sensitive to market entry points because of the return cushion provided by the fixed income component—a cushion that is particularly sizeable today.
Investment-grade sectors have experienced some of the largest yield increases, with the nominal yield to worst1 (YTW) on the Bloomberg U.S. Aggregate Index almost tripling since the start of 2022. Now higher-quality, longer-duration bonds are compensating investors much more than they have historically based on their level of risk versus non-investment-grade assets. We are seeing the lowest yield pick-up between U.S. aggregate and U.S. high yield issues in over a decade.
Starting yields have been a reliable indicator of future returns.
High current yields bode well for core and core plus strategies, as they have historically served as a good proxy for future returns. For example, our research shows that, for high-quality fixed income portfolios, the long-term correlation between the starting yield of the Bloomberg U.S. Aggregate Index and the Index's subsequent five-year return is 0.94, as illustrated in Display 1. The correlation is the same or higher when looking at returns for subsequent six- through 10-year periods.
Correlations are also positive across time periods for individual sectors of the U.S. income market. That said, they are generally not as strong as correlations for the broad market index, highlighting the diversification benefits of core and core plus strategies. These types of multi-sector approaches not only help mitigate risk, they allow active managers to make relative-value calls between sectors and across the maturity and credit-quality spectrum.
Of the various fixed income sectors we evaluated, the predictive power of yield was weakest for lower-quality high yield bonds, reflecting their default risk. Because of the principal losses associated with defaults and variable liquidation outcomes, a below investment-grade-only bond allocation with, for example, a 6% yield might ultimately realize a lower yield.
A diversified investment-grade portfolio typically has a much higher probability of earning its starting yield relative to a lower-quality fixed income portfolio, particularly one with much higher default risk. We believe this greater predictive power is especially important as we position client portfolios for an uncertain macroeconomic outlook with a high probability of a shallow to moderate recession.
The Fed has signaled a pivot from its restrictive stance, which has historically been a compelling time to increase duration in fixed income allocations.
Underlying inflation in the U.S. has slowed considerably, with the change in the core PCE price index—the Fed's preferred inflation gauge—recently falling below the central bank's 2% target on a six-month annualized basis. In response, the FOMC has indicated that it has ended its rate hiking cycle and intends to pivot in 2024. Based on historical trends, this may be an opportune time to add duration. The 10-year Treasury yield has rallied after the Fed's final rate increase in each of the past five tightening cycles.
Should rates fall over the year as we envision, core and core plus strategies with intermediate-term durations have the potential to generate total returns that are substantially higher than current yields—yields near post-crisis highs. This type of environment is less beneficial for lower-quality, higher-leveraged income sectors due to their much lower sensitivity to interest rates (lower effective durations). Moreover, we believe many of the lagged effects of cumulative Fed tightening will continue to play out, and that slowing growth and accelerating defaults will pressure lower-quality sectors. So within an actively managed multi-sector construct, a focus on quality seems warranted at this time.
Historical performance patterns lend additional support to our favorable outlook for intermediate-duration strategies. As shown in Display 2, intermediate core plus bond funds produced attractive total returns in one- and three-year periods after the final Fed hike of the last five tightening cycles. Beyond delivering attractive absolute returns, intermediate core plus funds outperformed various short-duration strategies in all three-year periods and nearly all one-year periods—in most cases, by significant margins. In our view, this strongly suggests that investors should be minimizing cash and cash equivalents and moving further out the curve.

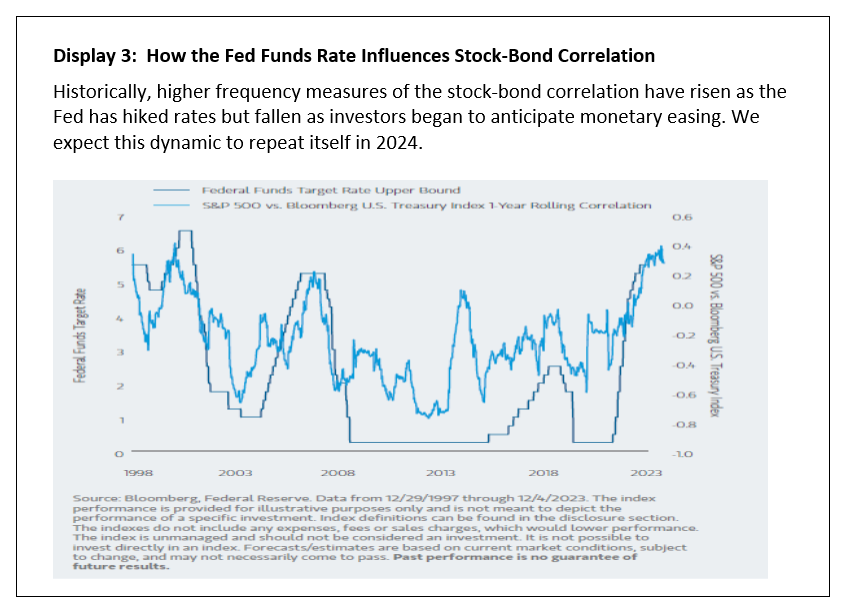
Correlations between bonds and risk assets should normalize as the Fed cuts rates.
The deeply negative correlation of stocks and bonds was the linchpin to the attractive risk-return characteristics of balanced portfolios (60/40) in the years following the financial crisis. Then COVID-19 hit, and the correlation rose sharply as soaring inflation prompted the fastest increase in the federal funds rate since the FOMC began targeting it in 1982, as shown in Display 3. The Fed's pivot to rate cuts should lead to a lower stock-bond correlation in 2024.
Bottom line: We believe investors should give serious thought to increasing actively managed core and core plus exposure given the strong return profile of higher-quality, longer-duration U.S. fixed income. After a difficult two years, we see a compelling backdrop for fixed income in 2024. In fact, we think a global regime change characterized by deglobalization, higher structural inflation, quantitative tightening, increased geopolitical risk and higher government debt suggests that 2024 is the start of a new era for fixed income investing. Under this scenario, we believe active core fixed income will resume its traditional and critical role of providing investors with income and portfolio diversification.
We also believe investors can enhance the return profile of core and core plus fixed income by allocating to strategies with the flexibility to capitalize on relative value opportunities identified through bottom-up fundamental research. We anticipate many such opportunities in 2024 as variability in economic, monetary policy and geopolitical outcomes lead to market volatility and meaningful valuation dispersion among sectors, industries and securities. And while we are currently emphasizing quality in portfolios, there may be opportunities for actively managed core plus strategies to invest in non-investment-grade assets to further enhance returns.
_____________________________________________________________________________1 Yield to worst is a measure that reflects the lowest potential yield earned on a bond without the issuer defaulting. The yield to worst is calculated by making worst-case scenario assumptions by calculating the returns that would be received if provisions, including prepayment, call or sinking fund, are used by the issuer.
The index performance is provided for illustrative purposes only and is not meant to depict the performance of a specific investment. Past performance is no guarantee of future results.
Bloomberg U.S. Aggregate Index is an unmanaged index of domestic investment-grade bonds, including corporate, government and mortgage-backed securities. "Bloomberg®" and the Bloomberg Index/Indices used are service marks of Bloomberg Finance L.P. and its affiliates and have been licensed for use for certain purposes by Morgan Stanley Investment Management (MSIM). Bloomberg is not affiliated with MSIM; does not approve, endorse, review or recommend any product; and does not guarantee the timeliness, accuracy or completeness of any data or information relating to any product.
Featured Insights


Risk Considerations: Diversification does not eliminate the risk of loss. Fixed income securities are subject to the ability of an issuer to make timely principal and interest payments (credit risk), changes in interest rates (interest-rate risk), the creditworthiness of the issuer and general market liquidity (market risk). In a rising interest-rate environment, bond prices may fall and may result in periods of volatility and increased portfolio redemptions. In a declining interest-rate environment, the portfolio may generate less income. Longer-term securities may be more sensitive to interest rate changes.
The views and opinions and/or analysis expressed are those of the author or the investment team as of the date of preparation of this material and are subject to change at any time without notice due to market or economic conditions and may not necessarily come to pass. Furthermore, the views will not be updated or otherwise revised to reflect information that subsequently becomes available or circumstances existing, or changes occurring, after the date of publication. The views expressed do not reflect the opinions of all investment personnel at Morgan Stanley Investment Management (MSIM) and its subsidiaries and affiliates (collectively “the Firm”), and may not be reflected in all the strategies and products that the Firm offers.
Forecasts and/or estimates provided herein are subject to change and may not actually come to pass. Information regarding expected market returns and market outlooks is based on the research, analysis and opinions of the authors or the investment team. These conclusions are speculative in nature, may not come to pass and are not intended to predict the future performance of any specific strategy or product the Firm offers. Future results may differ significantly depending on factors such as changes in securities or financial markets or general economic conditions.
This material has been prepared on the basis of publicly available information, internally developed data and other third-party sources believed to be reliable. However, no assurances are provided regarding the reliability of such information and the Firm has not sought to independently verify information taken from public and third-party sources.
This material is a general communication, which is not impartial and all information provided has been prepared solely for informational and educational purposes and does not constitute an offer or a recommendation to buy or sell any particular security or to adopt any specific investment strategy. The information herein has not been based on a consideration of any individual investor circumstances and is not investment advice, nor should it be construed in any way as tax, accounting, legal or regulatory advice. To that end, investors should seek independent legal and financial advice, including advice as to tax consequences, before making any investment decision.
Charts and graphs provided herein are for illustrative purposes only. Past performance is no guarantee of future results. The indexes are unmanaged and do not include any expenses, fees or sales charges. It is not possible to invest directly in an index. Any index referred to herein is the intellectual property (including registered trademarks) of the applicable licensor. Any product based on an index is in no way sponsored, endorsed, sold or promoted by the applicable licensor and it shall not have any liability with respect thereto.