


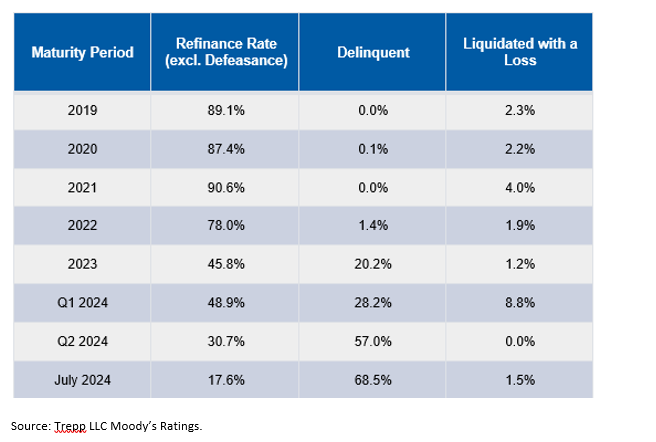
The COVID-19 pandemic has fundamentally changed the way Americans work. The proliferation of remote and hybrid work schedules has significantly decreased the demand for office space in major cities, with office vacancy rates reaching 20.1% nationwide in Q2 2024, exceeding 20%1 for the first time. The trend away from fully in-person work schedules has already begun to impact the owners and developers of these buildings. Figure 1 illustrates how the delinquency rate on maturing office loans has spiked to 68.5% as of July 31, 2024, from 0.1% in 2020, while the pace of refinancings has dropped exponentially.
Figure 1: Resolutions for Office Loans Scheduled to Mature Between 2019 and July 31, 2024
The private-side economics of the office commercial real estate (CRE) market is already showing significant strain, and while these struggles have the potential to affect major municipalities' budgets, we remain comfortable with the overall credit health of major cities.
Concern Varies by Cities
Individual cities can have vastly different budget structures with various levels of reliance on commercial real estate taxes, and as a result, the degree of concern varies significantly.
Figure 2: Most Larger U.S. Cities Exhibit Good Revenue Diversity
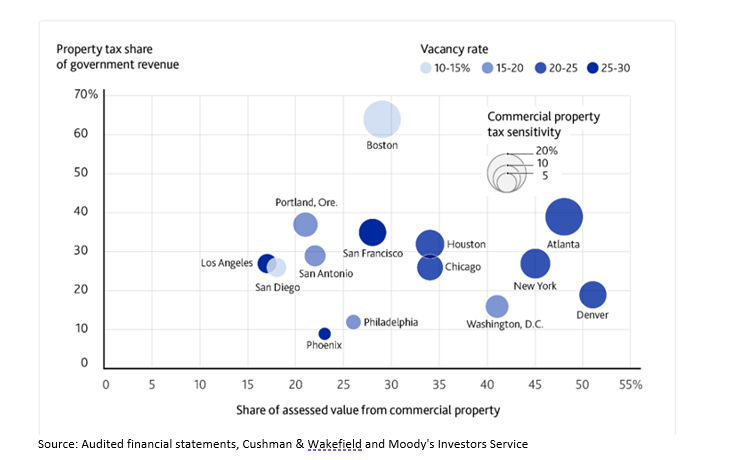
The figure above illustrates the variability of reliance on CRE tax revenues. For example, S&P AA-rated New York City (NYC), has an extremely diversified revenue stream and even in a doomsday scenario, in which office building assessed values (AVs) are cut by 25% overnight, the total negative impact to NYC's budget would be less than 1.4% of revenues. On the other hand, S&P AAA-rated Boston's budget is significantly more reliant on CRE property tax revenue and the same doomsday scenario would lead to a 7% decrease in revenue. Essentially, the impact office vacancies have on any municipality is a function of what proportion of its budget is reliant on CRE property taxes, as well as the city's plans for replacing lost CRE revenues.
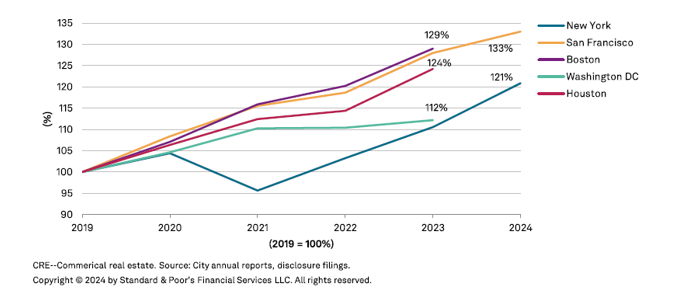
The timeline of concerns, as well as the insulated nature of local tax assessments, levies and collections, vary significantly across states. Property tax levies lag market value trends, thus significant changes to real estate market values and AVs are typically reflected in city revenues multiple years after shifts occur. For example, while vacancy rates are exceedingly high in San Francisco (rated AAA by S&P), the aggregate AV of the city increased more than 7% in fiscal 2023.
Figure 3: Assessed Value Growth Remains Strong Despite CRE Volatility (Real estate value growth since 2019)
Major Cities Have an Array of Options
Municipal financial officers have significant time to address the potential budget shortfalls and may actively plan to fortify budgets. The market value of real estate is often significantly larger than the AV, even though the property taxes are derived from the AVs. Moreover, many states cap the rate at which AVs can grow each year, leading to a large discrepancy between the figures. For example, Proposition 13 in California has capped the property tax levy at 1% of AV, and the yearly growth rate of the levy at 2%. Given that market values of properties in California have grown significantly faster than the prop-13 mandated 2% AV growth, there is significant buffer room between the values. This is important as even if market values of properties begin to decline, AVs can continue to grow.
Large cities have several options to rebalance budgets. Boston, for example, offers a residential property tax exemption credit, which has grown over 25% since 2020. While politically unpopular, cutting the value of the exemption, stiffening qualification requirements or simply slowing the growth rate of the exemption could have significant positive impacts on revenues. We estimate Boston residential property taxpayers are exempted from hundreds of millions in taxes annually. Beyond adjusting property tax levy inputs, there are many other revenue sources that can be tapped including excise taxes and various business taxes.
Bottom line: While depressed assessed values of office buildings may have an adverse effect on certain municipal budgets, we are not overwhelmingly concerned about the underlying credit health of these cities. In our view, the recent influx of headlines regarding depressed office building values are significantly more impactful to private owners and developers, rather than municipalities. Municipal financial officers are able to implement a number of strategies to offset these short-term challenges.
1 Source: Moody's Q2 2024 Preliminary Trend Announcement.
Featured Insights


Risk considerations: There generally is limited public information about municipal issuers. Investments in income securities may be affected by changes in the creditworthiness of the issuer and are subject to the risk of non-payment of principal and interest. The value of income securities also may decline because of real or perceived concerns about the issuer's ability to make principal and interest payments. As interest rates rise, the value of certain income investments is likely to decline.
The views and opinions and/or analysis expressed are those of the author or the investment team as of the date of preparation of this material and are subject to change at any time without notice due to market or economic conditions and may not necessarily come to pass. Furthermore, the views will not be updated or otherwise revised to reflect information that subsequently becomes available or circumstances existing, or changes occurring, after the date of publication. The views expressed do not reflect the opinions of all investment personnel at Morgan Stanley Investment Management (MSIM) and its subsidiaries and affiliates (collectively "the Firm"), and may not be reflected in all the strategies and products that the Firm offers.
The views and opinions and/or analysis expressed are those of the author or the investment team as of the date of preparation of this material and are subject to change at any time without notice due to market or economic conditions and may not necessarily come to pass. Furthermore, the views will not be updated or otherwise revised to reflect information that subsequently becomes available or circumstances existing, or changes occurring, after the date of publication. The views expressed do not reflect the opinions of all investment personnel at Morgan Stanley Investment Management (MSIM) and its subsidiaries and affiliates (collectively “the Firm”), and may not be reflected in all the strategies and products that the Firm offers.
Forecasts and/or estimates provided herein are subject to change and may not actually come to pass. Information regarding expected market returns and market outlooks is based on the research, analysis and opinions of the authors or the investment team. These conclusions are speculative in nature, may not come to pass and are not intended to predict the future performance of any specific strategy or product the Firm offers. Future results may differ significantly depending on factors such as changes in securities or financial markets or general economic conditions.
This material has been prepared on the basis of publicly available information, internally developed data and other third-party sources believed to be reliable. However, no assurances are provided regarding the reliability of such information and the Firm has not sought to independently verify information taken from public and third-party sources.
This material is a general communication, which is not impartial and all information provided has been prepared solely for informational and educational purposes and does not constitute an offer or a recommendation to buy or sell any particular security or to adopt any specific investment strategy. The information herein has not been based on a consideration of any individual investor circumstances and is not investment advice, nor should it be construed in any way as tax, accounting, legal or regulatory advice. To that end, investors should seek independent legal and financial advice, including advice as to tax consequences, before making any investment decision.
Charts and graphs provided herein are for illustrative purposes only. Past performance is no guarantee of future results. The indexes are unmanaged and do not include any expenses, fees or sales charges. It is not possible to invest directly in an index. Any index referred to herein is the intellectual property (including registered trademarks) of the applicable licensor. Any product based on an index is in no way sponsored, endorsed, sold or promoted by the applicable licensor and it shall not have any liability with respect thereto.