


KEY POINTS
1. During presidential election years over most of the last century, on average both U.S. large- and small-cap value have outperformed their growth peers.
2. Value vs. Growth's dominance in election years also correlates with U.S. gross domestic product (GDP) growth and detraction.
3. Incumbent candidates and parties keen to win reelection seek to make voters feel financially secure when heading to the polls.
As two thirds of global voters in democratically-elected governments go to the polls in 2024, politics are top of mind and will almost certainly impact the stock market this year. Kicking off the year, there is a major bifurcation in the market that leans heavily on general skepticism for global growth.
To set the stage, we look back at the last century of U.S. presidential elections and highlight a few notable statistics about historical markets during election years:
- On average, during presidential election years, both U.S. large and small-cap value outperform their growth peers1 - in fact, large cap-value outperformed large-cap growth in 17 of the past 23 election years, dating back to 1932.
- Zooming in on presidential elections between 1944 and 2020, U.S. gross domestic product (GDP) contracted in two of the last three quarters of the five of the six election years that value did not outperform.
Growth vs. Value Performance During Election Years
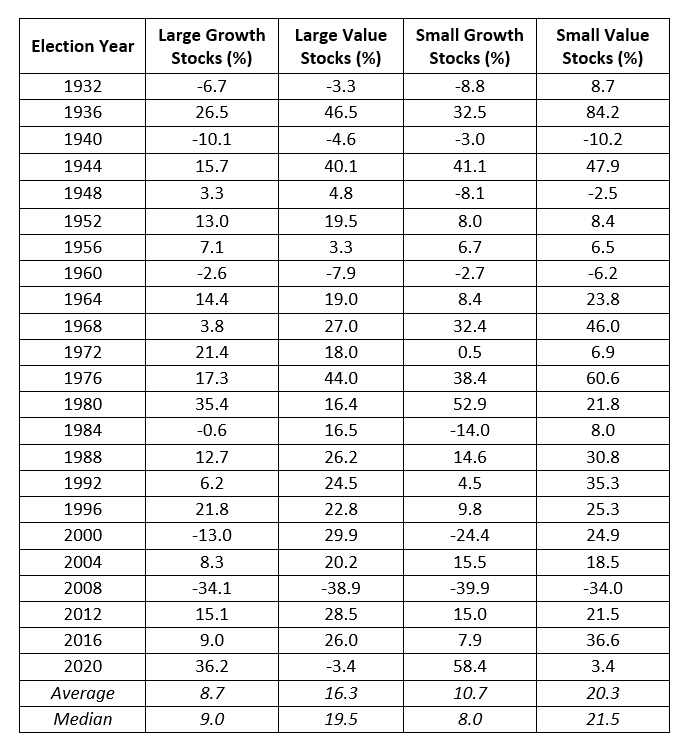
Source: Strategas, Fama-French Growth & Value Series
In 13 of the above elections, an incumbent candidate was running for reelection. Large value stocks underperformed large growth stocks only in 1972 and 1980 during those 13 years.
Economic growth is very important in the election cycle. Incumbent candidates and parties keen to win reelection seek to make voters feel financially secure when heading to the polls. Parties in office will, therefore, attempt to stimulate growth as much as possible through fiscal spending and possibly even monetary policy. Historically, this stimulation can be positive for both cyclical and small-cap stocks.
This phenomenon could be impactful for the market in a year such as 2024, potentially driving a broadening of the equity market beyond mega-cap companies. In our view, we are now back to prior extreme peaks in valuation for some of these companies and excessive narrowness in the market. Elsewhere, while there was multiple expansion during 2023, cyclicals sectors (such as consumer discretion, energy, basic materials and financials) lacked notable momentum.
At An Extreme: Nasdaq 100 Stock Index & Bloomberg Commodity Spot Index
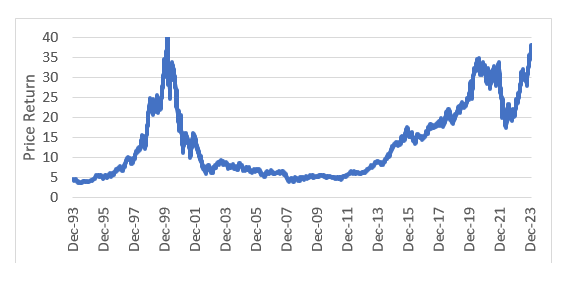
Source: Bloomberg, as of February 12, 2024. The Nasdaq 100 has traded so strongly over the last year (and vice versa for the Commodity Index), and they are at an extreme valuation difference due to narrowness/stretched valuations in growth currently in the market.
While history does not always repeat itself, it typically has some valuable lessons. As we have written in a previous blog about how the Magnificent Seven2 have indeed lived up to their name, we believe much of this is due to recency bias and hopes for the future potential of artificial intelligence (AI). With the Magnificent Seven now at stretched valuations, and given the history of election years and spending, a balanced allocation likely makes sense.
We do not believe a rising tide will potentially lift all boats here. As earnings revisions fall into place, selectivity and having a well-defined thesis is essential. Our Opportunistic Value investment philosophy focuses on quality, leading companies that are mispriced or misunderstood by the market and are trading at a discount to their intrinsic value.
Bottom Line: We believe 2024 has several unique components to it, including a U.S. presidential election and the Federal Reserve's continued balancing act between maintaining inflation and growing the economy. Active management becomes more essential in an environment with many different drivers at play, in navigating and finding true potential opportunities in this unprecedented environment.
1 "Growth" and "Value" defined by Fama French, which uses attributes that define both elements, rather than index provider definitions. Fama and French Three-Factor Model (or Fama French Model for short) is an asset pricing model developed in 1992 that expands on the capital asset pricing model (CAPM) by adding size risk and value risk factors to the market risk factor in CAPM.
2 Magnificent Seven refers to Alphabet, Amazon, Apple, Meta Platforms, Microsoft, Nvidia, and Tesla.
Featured Insights


Risk Considerations: The value of investments may increase or decrease in response to economic, and financial events (whether real, expected or perceived) in the U.S. and global markets. The value of equity securities is sensitive to stock market volatility. Diversification does not eliminate the risk of loss.
Forecasts and/or estimates provided herein are subject to change and may not actually come to pass.
Correlation is a statistical measure of how two securities move in relation to each other.
Index performance is shown for illustrative purposes only and is not intended to represent historical or to predict future performance of any specific investment or strategy. Past performance is not a guarantee of future results.
Nasdaq 100 Stock Index is a collection of the 100 largest, most actively traded companies listed on the Nasdaq stock exchange.
Bloomberg Commodity Spot Index measures the price movements of commodities included in the Bloomberg CI and select subindexes.
The views and opinions and/or analysis expressed are those of the author or the investment team as of the date of preparation of this material and are subject to change at any time without notice due to market or economic conditions and may not necessarily come to pass. Furthermore, the views will not be updated or otherwise revised to reflect information that subsequently becomes available or circumstances existing, or changes occurring, after the date of publication. The views expressed do not reflect the opinions of all investment personnel at Morgan Stanley Investment Management (MSIM) and its subsidiaries and affiliates (collectively “the Firm”), and may not be reflected in all the strategies and products that the Firm offers.
Forecasts and/or estimates provided herein are subject to change and may not actually come to pass. Information regarding expected market returns and market outlooks is based on the research, analysis and opinions of the authors or the investment team. These conclusions are speculative in nature, may not come to pass and are not intended to predict the future performance of any specific strategy or product the Firm offers. Future results may differ significantly depending on factors such as changes in securities or financial markets or general economic conditions.
This material has been prepared on the basis of publicly available information, internally developed data and other third-party sources believed to be reliable. However, no assurances are provided regarding the reliability of such information and the Firm has not sought to independently verify information taken from public and third-party sources.
This material is a general communication, which is not impartial and all information provided has been prepared solely for informational and educational purposes and does not constitute an offer or a recommendation to buy or sell any particular security or to adopt any specific investment strategy. The information herein has not been based on a consideration of any individual investor circumstances and is not investment advice, nor should it be construed in any way as tax, accounting, legal or regulatory advice. To that end, investors should seek independent legal and financial advice, including advice as to tax consequences, before making any investment decision.
Charts and graphs provided herein are for illustrative purposes only. Past performance is no guarantee of future results. The indexes are unmanaged and do not include any expenses, fees or sales charges. It is not possible to invest directly in an index. Any index referred to herein is the intellectual property (including registered trademarks) of the applicable licensor. Any product based on an index is in no way sponsored, endorsed, sold or promoted by the applicable licensor and it shall not have any liability with respect thereto.